NVIDIA Driver Test with Battlefield: Hardline Beta

Tonight I was prompted to download the new NVIDIA 340.43 Beta driver. The description mentioned adding support for the recently released Battlefield: Hardline Beta. I’ve been running with the stable driver 337.88 since installing Hardline, and all has been fine. Performance has been OK really, except for some weird animations (dead bodies twitch on the floor) when people die, or when you get too close to wall (the wall turns transparent), but me being me I decided to compare the two drivers.

I’ll note, I was excited to make this comparison because of the recent 337.88 series driver. It got quite a lot of media coverage because of its 10% performance improvement over its predecessor. 340.43 most likely wont be another 10%, but I’m curious.

Click this graph for a bigger view. It’s better on the eyes!

BF Hardline FPS 337 vs 340


What’s interesting here is the lack of raw performance, but the honing in on consistency. The new driver provides more stable performance with fewer spikes. It does however, add a few big drops though. Like the one at 145 sec. Not sure what was going on in the game, but the new driver didn’t seem to like it. The previous spike at 280 seconds is gone. This was, I think, is when the crane falls. The new driver make better work out of that scene.


LEGO HTPC / Server Project (pt 3 dealing with heat)

First Run Heat Issues:

The server was initially intended to run without any fans. The CPU is/was low power and comes with a fan-less heat-sink, and the HDD’s are pretty much out in the open. Perfect, I thought, lets get this show on the road. Upon first power up it was apparent this was going to be an issue. The CPU slowly started to rise up to its 80C alarm limit, and the HDD’s quickly shot up to 47C. Ideally, the CPU should be in the mid 30’s and the HDD’s should be under 40C.

To fix the issue, the main fan was connected to the server’s motherboard. Straightforward right? nope… The motherboard is only setup to control 4-pin PWN fans, and thus blasts the fans with a constant +12V. The 3-pin fan shot right up to 3000 RPM. To lower the speed and noise, I installed a resistor inline with the fan’s power lead. This drooped the voltage to the fan to where it now sits at a nice quiet 1000 RPM. The CPU now runs around the 35C mark.

The HDD’s presented more of a challenge as the case was designed to be fan-less. I had some 40mm fan lying around, and again luckily for me, they were a perfect fit into the existing ventilation gaps. The fans were all connected to the server’s motherboard. Straightforward right? nope… The motherboard is only setup to control 4-pin PWN fans, and thus blasts the fans with a constant +12V. The 3-pin 3-pin fan shot right up to 4000 RPM. To lower the speed and noise, I connected the fans to the +5V rail off the power supply. They now run at a nice quiet 1000 RPM. The HDD’s now run around the 37C mark.

Google has published a really nice white paper on HDD failure analysis. The paper focuses on consumer grade HDD’s and operating conditions effecting their longevity. http://research.google.com/pubs/pub32774.html. This is where I’m getting my temperature target of under 40C from.


DSC00257_1


— Update —

More Heat Issues:

Although elegant and simple, the above solution did not work as planned. In trying to the make most of that situation, I ended up installing a total of seven 40mm fans into the gaps shown above. And while they did lower the drive’s temperatures, they just weren’t able to keep them below 40C. They would idle at 37C or so, but on a warm day or under load they had no trouble getting up to 40C / 41C.

Enter solution #2. The 40mm fans were originally connected to the power supply’s 5V rail in hopes that 5V would spin the fans slowly and quietly. And it did just that. They were very quiet, but ultimately ineffective. This solution was to connect them to the 12V rail in hopes that a faster fan speed would provide extra cooling. All this really did was increase the noise they produced. No noticeable change in temperature. If I had to guess why, it would be the fans’ location. They were just circulating hot air.

Enter solution #3. The 40mm fans were removed altogether. Replaced by two 120mm fans sitting external to the enclosure. This would allow them to blow cool air at the drives, and move more air than seven 40mm fans ever could.

The 40mm fans are spec’d to move about 4cfm air. Multiply that by seven and the total volume of air they were able to move was 28cfm. Now looking at the 120mm fans, they are spec’d to move about 74cfm of air each, and I have two of them, producing a total of 148cfm or about 5x the volume. I know, I know, ugly Noctua brown. But they’re what I had lying around…

Case in point:

Without any fans the drives would idle at 47C.

With four 40mm fans @ 5V the drives would idle at 38C.

With seven 40mm fans @ 5V & 12V, the drives would idle at 37C.

With two 120mm fans, the drives now idle at a cool 28C.

DSC00266_ DSC00267_

LEGO HTPC / Server Project (pt 2 getten er up and running)

Now that the hardware is assembled, it’s time to dig into the configurations.

The most interesting aspect of this platform is that it supports the Intelligent Platform Management Interface (IPMI). The idea of IPMI is to remotely control the device. Accessing the boards BIOS, installing the OS, and viewing statistics can all be done remotely. This being my first experience with it, I was a little lost. But nothing to worry about. The board has a dedicated IPMI port, which gets assigned its own IP address. So, just hop onto another computer on the network and brows to the IMPI’s IP address. Finding the IP address can be tricky, but luckily for me my router has a nice feature to display connected devices on the network. 

ASRock C2750D4I


BIOS Configuration:

The motherboard’s BIOS can be configured from two places. The first being the native IPMI interface. The second from the BIOS’s GUI window. To access the IPMI interface, browse to the IPMI port’s IP address. From here you can configure settings or launch the remote console. The remote console runs a small java app to mimic a console. I had to turn the java security down to get my console to open. Once in the console, to launch the BIOS, restart the system and press the ‘del’ while booting. The system will now boot into BIOS. It is here where you configure the boot priority of the system. Because we’re booting from USB, choose USB as the #1 boot priority.

ipmi

console

Operating System:

I chose FreeNAS as my operating system. Having an established development and support community, it’s a good safe choice. Another nice option it provides is the ability to run from a USB stick. From the FreeNAS webpage, you simply download the USB image, write the image to a USB stick, and boot the system from USB. Once running, the OS runs from RAM, so wear-n-tear on the stick shouldn’t be an issue.

To install the OS, browse to the console window. Insert the USB stick into the motherboard, reboot the system, and wamooo. The system will boot from USB and into the FreeNAS environment. Once booted (mine took around 5 minutes) you may browse to the IP address of FreeNAS (note this is different than the IPMI’s IP address). FreeNAS is designed to controlled from a web based GUI, and does a really nice job at it. The following isn’t my image, but you get the idea.

Generally, you shouldn’t need to modify any settings. Basically, you’ll create a new storage pool, a new windows CIFS share, and modify permissions. At this point, you should be able to see the FreeNAS storage pool from any Windows computer on the network.

FreeNAS-Web-GUI

Total System Power Consumption:

During boot, the system consumes around 80W. After settling down, the system draws a steady 43W. Documentation says the HDD’s consume about 15W each during boot, and 5W each once running. This leaves the CPU /motherboard/RAM at around 20W.

DSC00246_1

LEGO HTPC / Server Project (pt 1 Hardware)

This HTPC/server project became a necessity a couple months ago when my existing home server started showing signs of wear. The old server had become too slow and too limited in capacity. The plan was to build new and combine my existing HTPC into the same enclosure. Where to go, where to go? Oh I know, LEGO!

The project had two goals. The first, obviously, was to look cool. The second was to have enough room for both the new server as well as my existing HTPC. Both PC’s would be mini ITX sized (17cm x 17cm) and my entertainment bench cubbyhole (where the server would end up sitting) was 18cm high. Perfect, I thought; the motherboards could be positioned vertically to fit within the space.

VIA_Mini-ITX_Form_Factor_Comparison

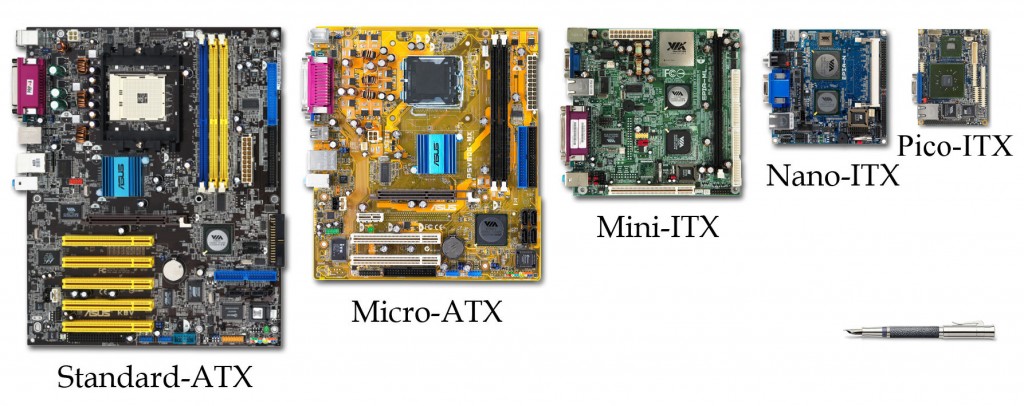
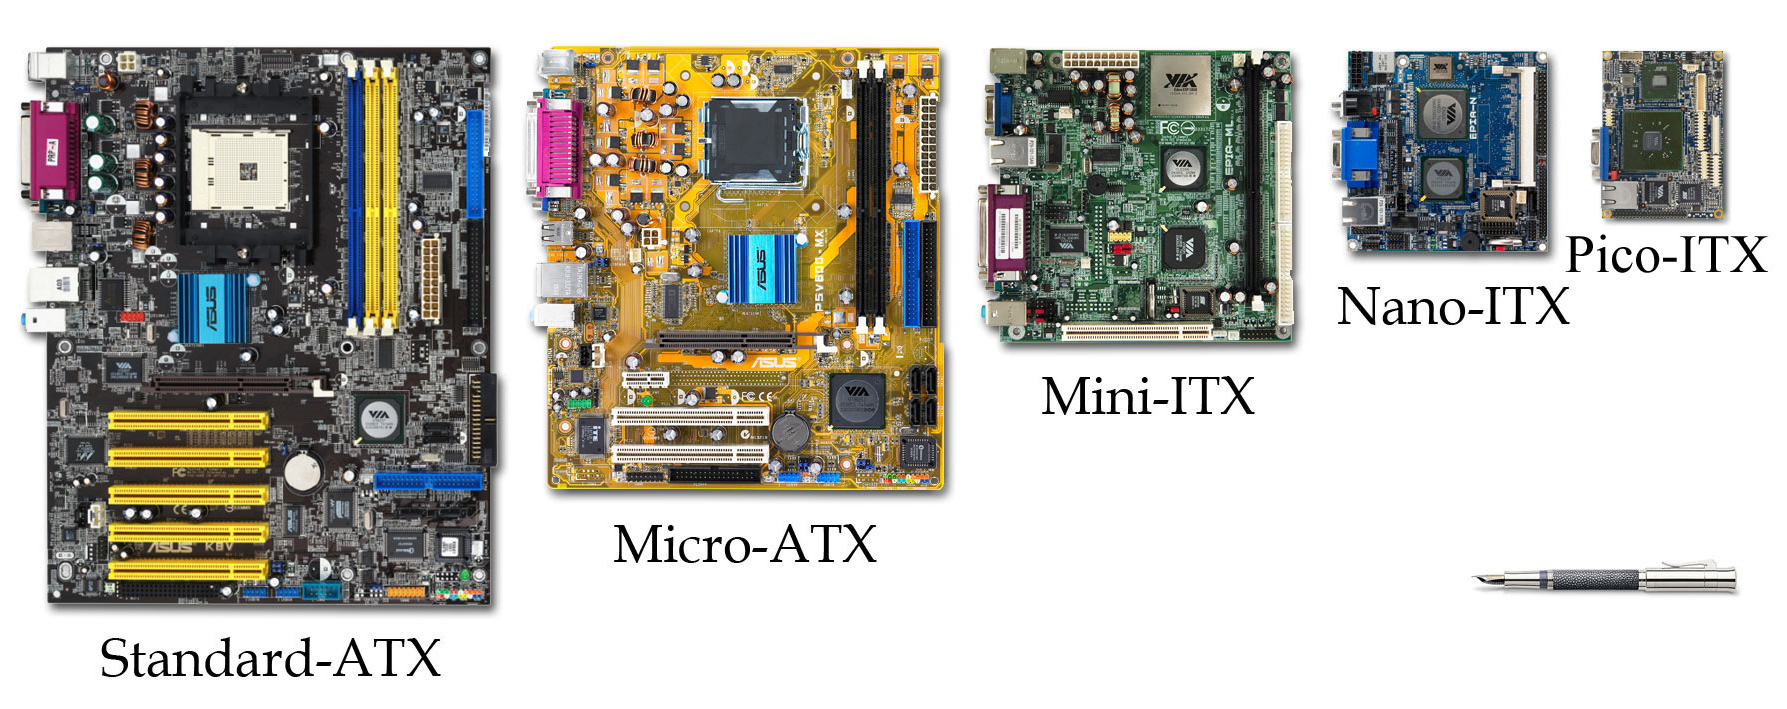
For reference, here are the various sizes of motherboards on the market.


The concept for the server/HTPC enclosure was an 18cm square box that would contain all the parts. This included two mini ITX motherboards, their respective drives, their power supplies, and a cooling fan. A tall order to fit inside an 18cm cube.

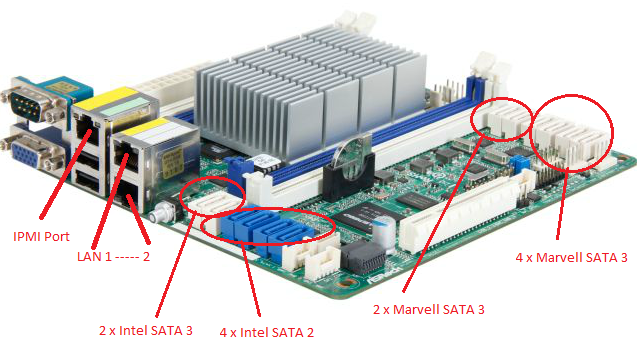
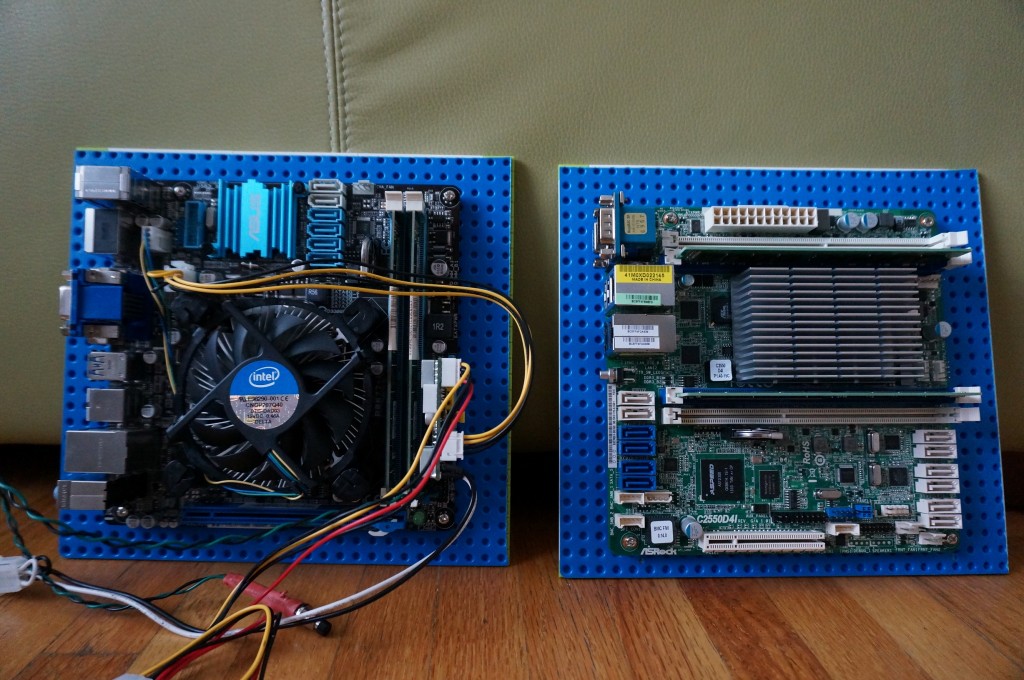
The server would have an ASRock c2550d4i motherboard powered by an Intel Avoton C2550 Quad-Core processor, with 16GB of memory and three 4TB WD Red HDD’s. I chose the processor because of its high-powered performance and its low power consumption: only 20 watts under full load.

asrock c2550d4i

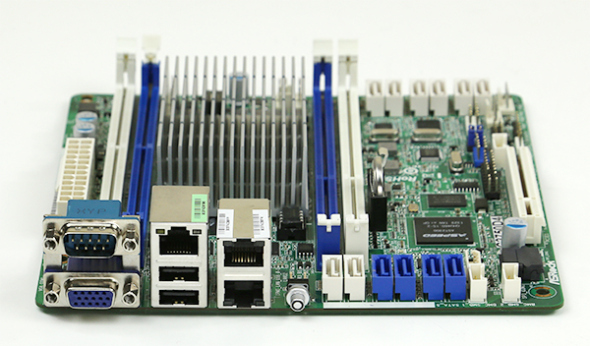
ASRock c2550d4i motherboard for new server

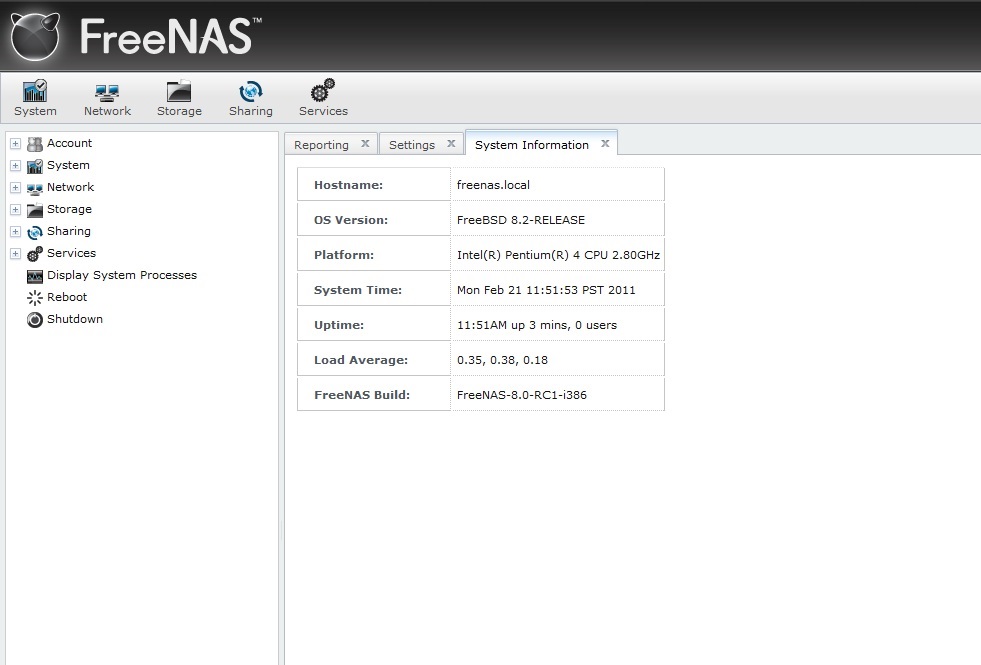
In terms of software, the server would run the FreeNAS OS and the HDD’s would be configured in a ZFS array. Three drives would be run in a ZFS-1 array, and a stretch goal of four drives (space permitting) would allow a ZFS-2 array. The ZFS-2 configuration provides double redundancy or failure protection for two HDD’s, where the ZFS-1 would only provide protection for one HDD. Let’s see how much space we have and decide on the configuration later.

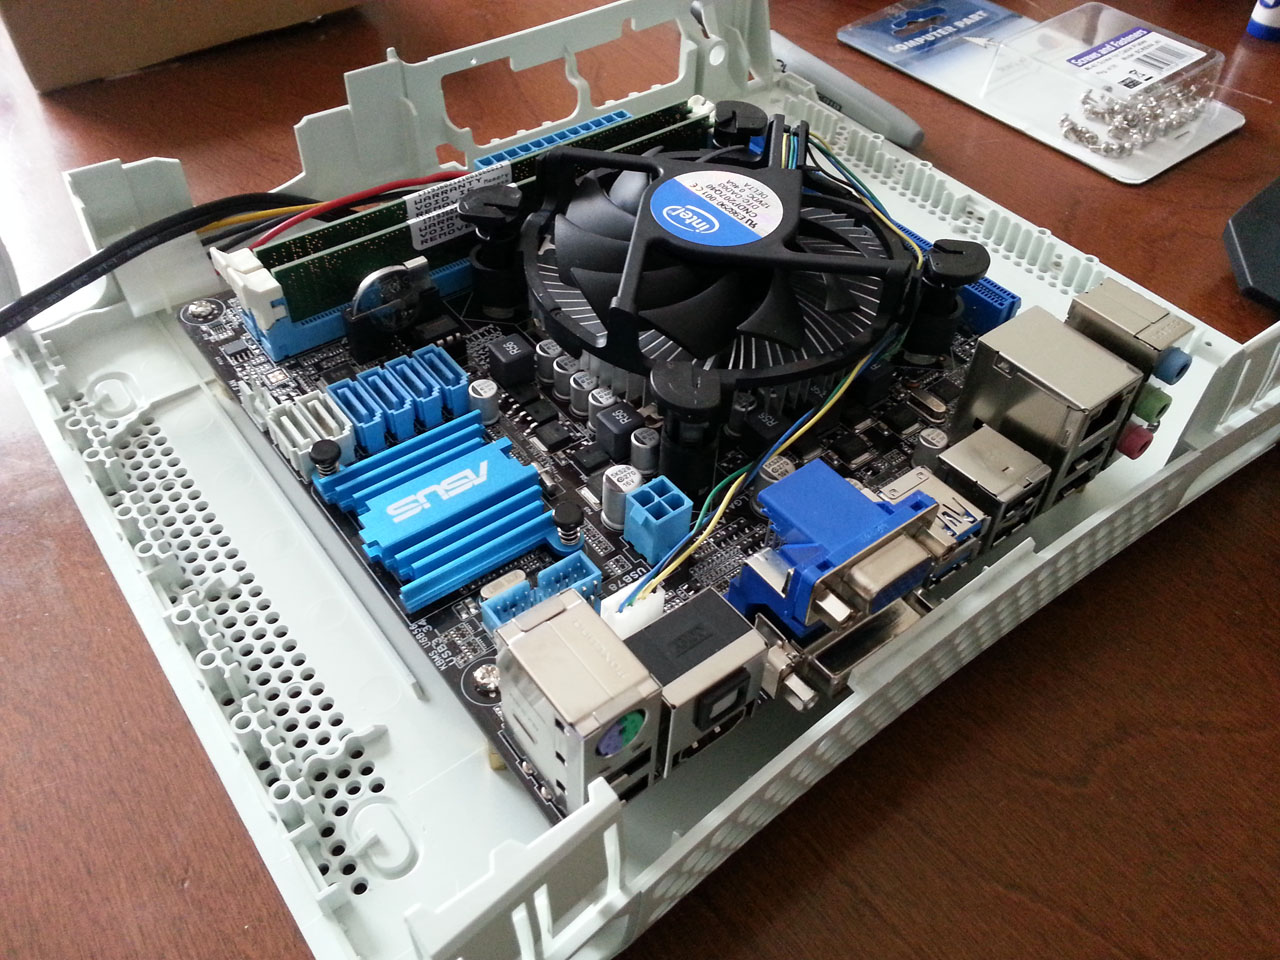
The HTPC would be a carryover from my previous XBMC project, which included an SSD.
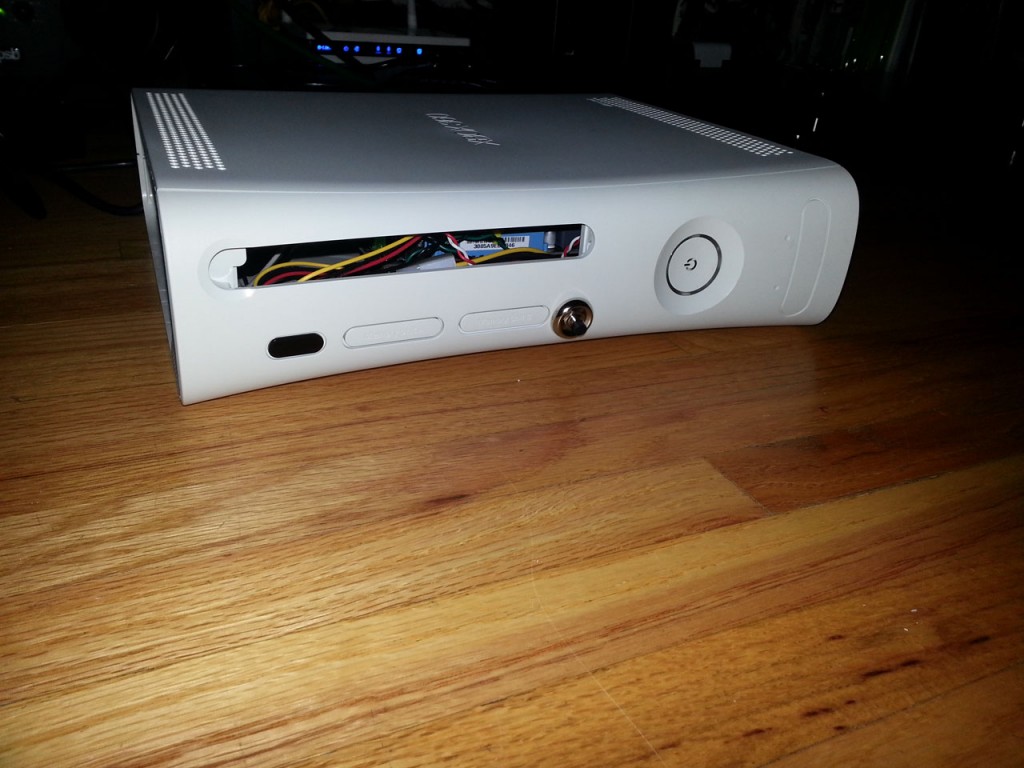
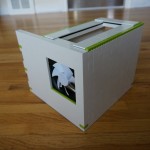
 

HTPC12

XBMC project case

HTPC05

XBMC project hardware

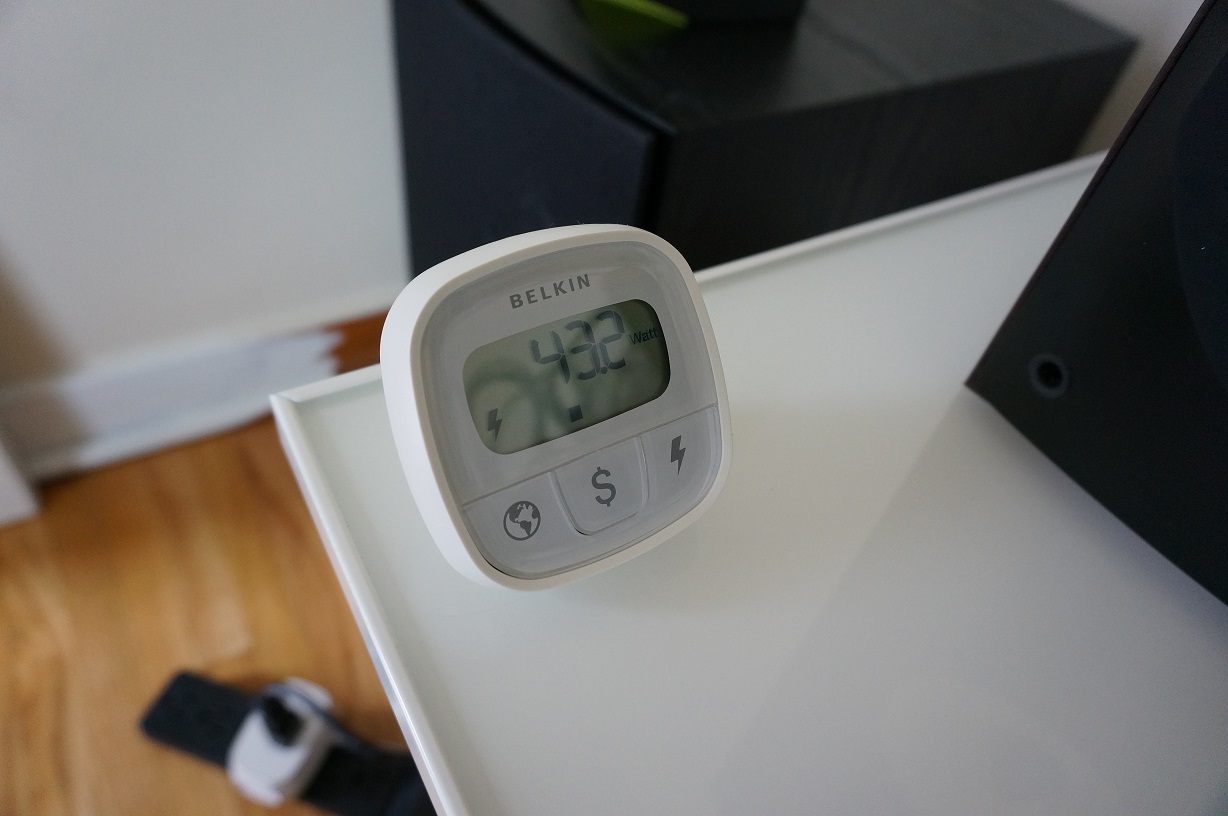
And the power supplies would be PicoPSU, which were the slimmest-profile bricks I could find. While the PicoPSU is a standard brick power supply that has an ITX-style power harness, it didn’t come any bigger than 160W.  By my calculations, the server would consume no more than 140W under full load and the HTPC would consumer no more than 70-80W under full load, so I crossed my fingers and hoped for the best.

picopsu

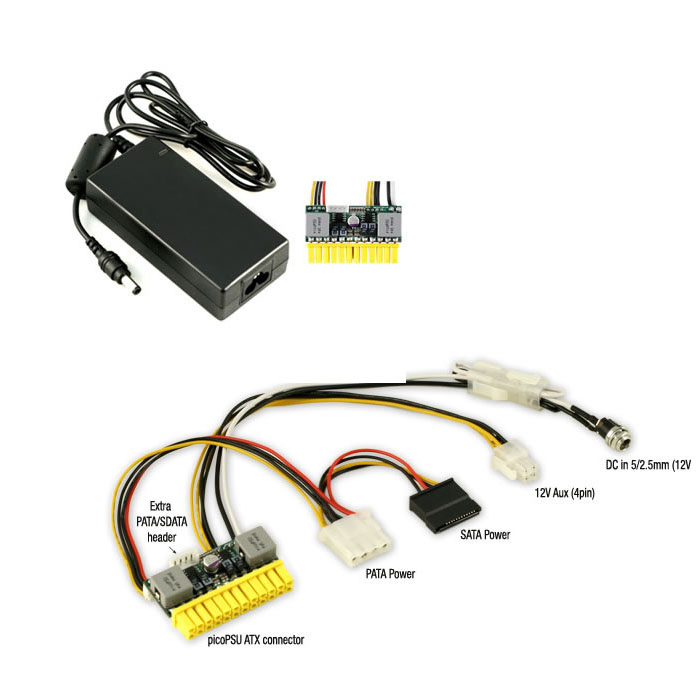
PicoPSU power supply


—Part I: Building the Enclosure—

Once I knew my hardware specs, it was time to design my enclosure with Lego. I chose a 25cm x 25cm LEGO base-plate for the foundation of my structure.

LEGO

The first Lego configuration had the four drives stacked on top of each other (left in photo) and the motherboards standing on their side (right in photo). The remaining space (at front of photo) was reserved for the two power supplies and cables.

Server_Org_2014 (1)

This concept was abandoned early on as the tower structure for the drives had no stability and could not handle the weight of three HDD’s and one SSD.

The second iteration of the enclosure saw the drives arranged vertically (right of photo), the motherboards standing on their sides (left of photo), and the power supplies stacked in the remaining space (back of photo).

Server_Org_2014 (2)

At this point, I made a decision to add another HDD to the server so that I would have at total of four 4TB HDDs. Since space within the enclosure was at a premium, I decided to mount the power supplies externally to make room.

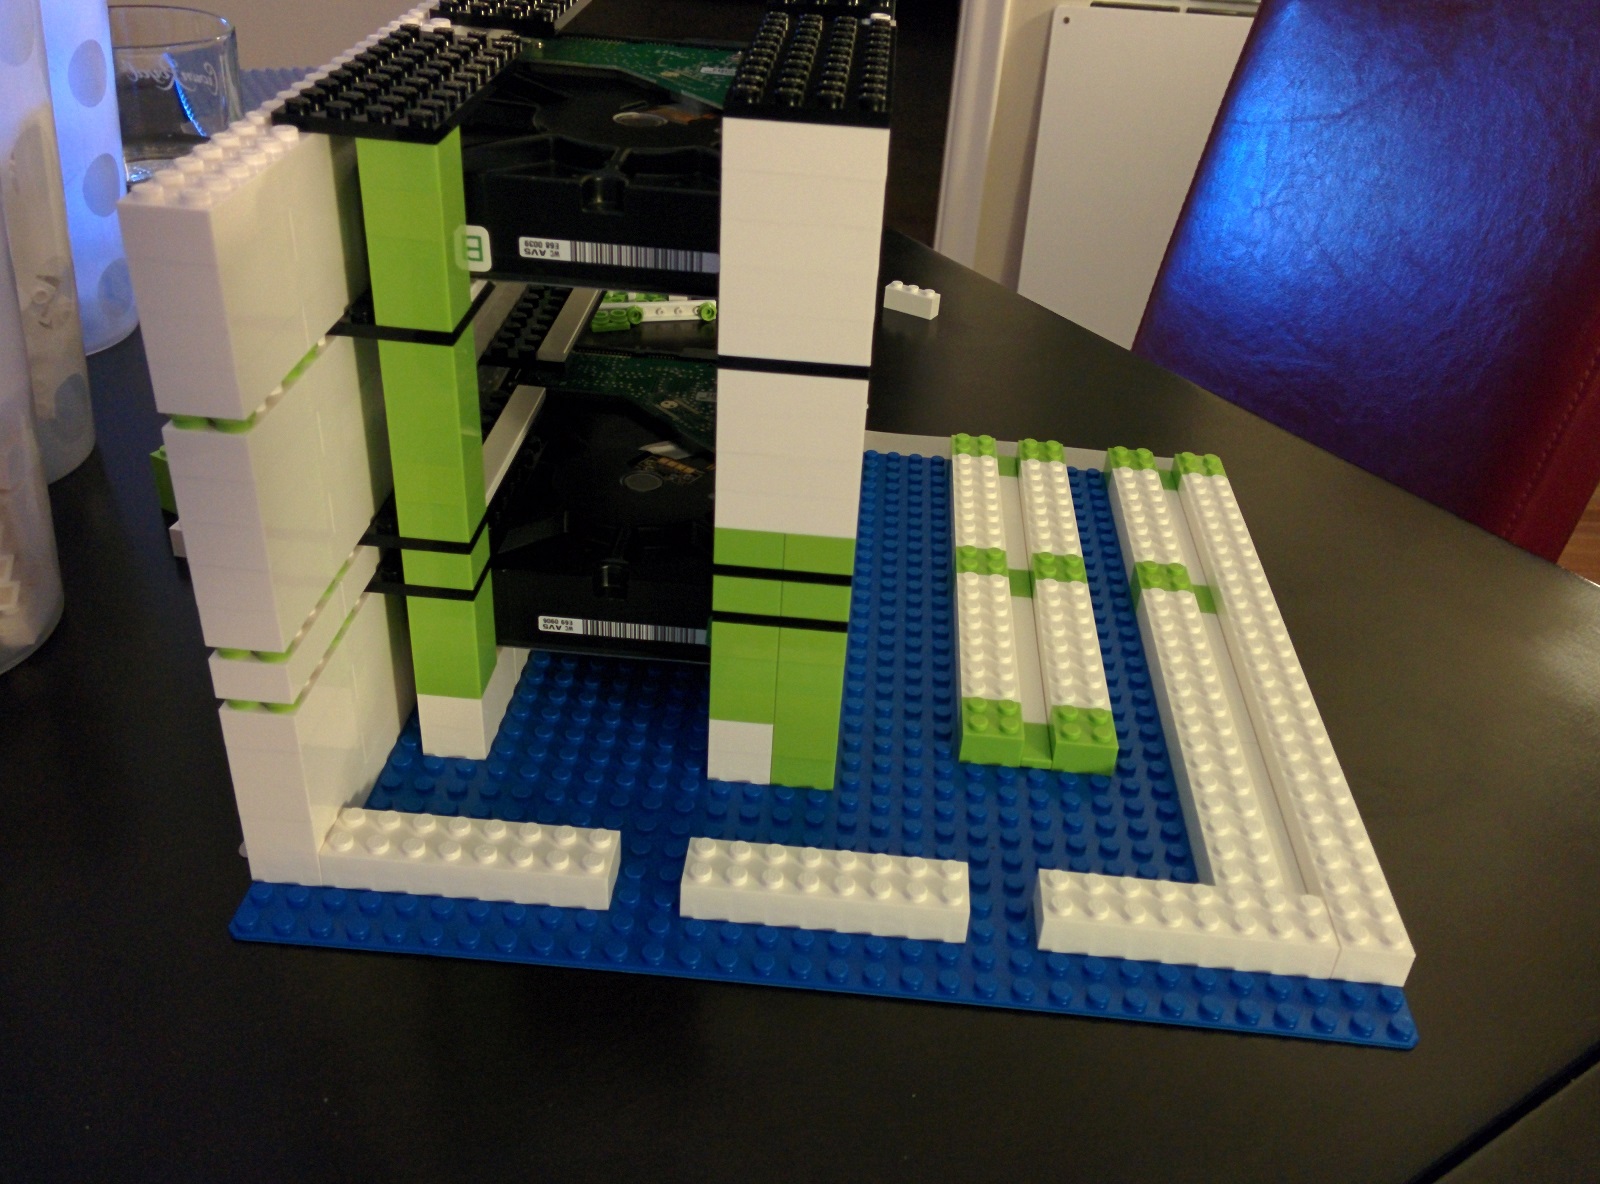
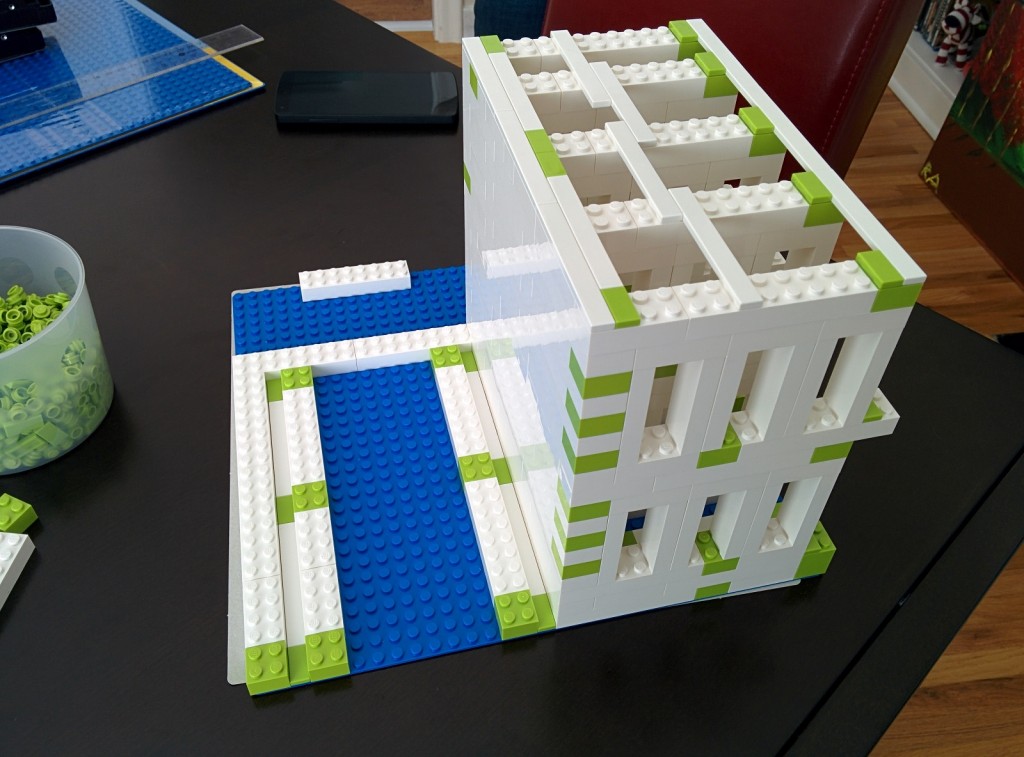
The final concept for the enclosure had a similar configuration as before, with the drives aligned vertically on half of my plaftorm and the motherboards perpendicular to the drives. This allowed me to have four HDD’s, one SSD, two motherboards AND a cooling fan built into the front wall of the case (back of photo).

Server_Org_2014 (3) Server_Org_2014 (4) Server Build 2014 (2) Server Build 2014 (6)Server Build 2014 (17)

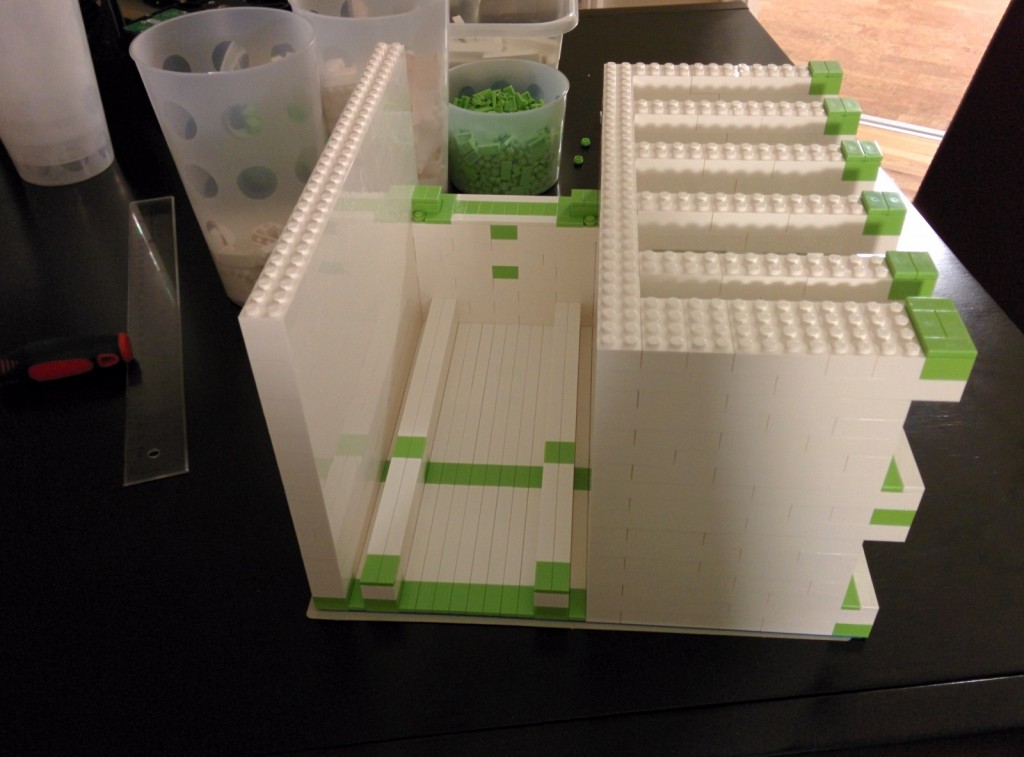
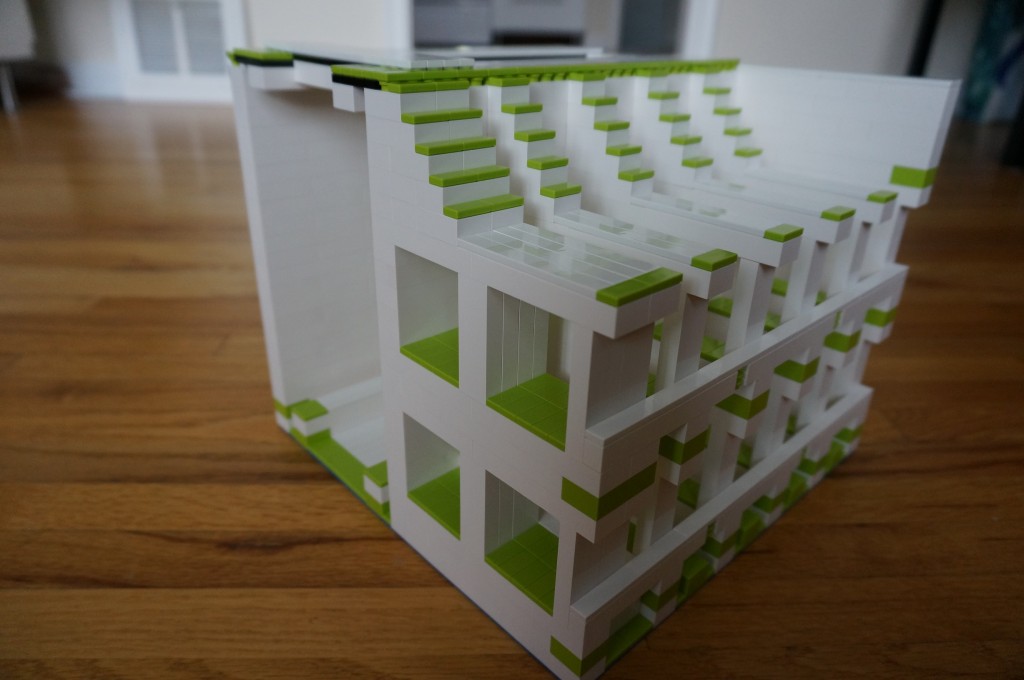
This concept was built up to this point where the parts could be test fitted. Not wanting to spend another evening ripping apart the previous night’s work, we made sure all the hardware would fit. And sure enough, it did!

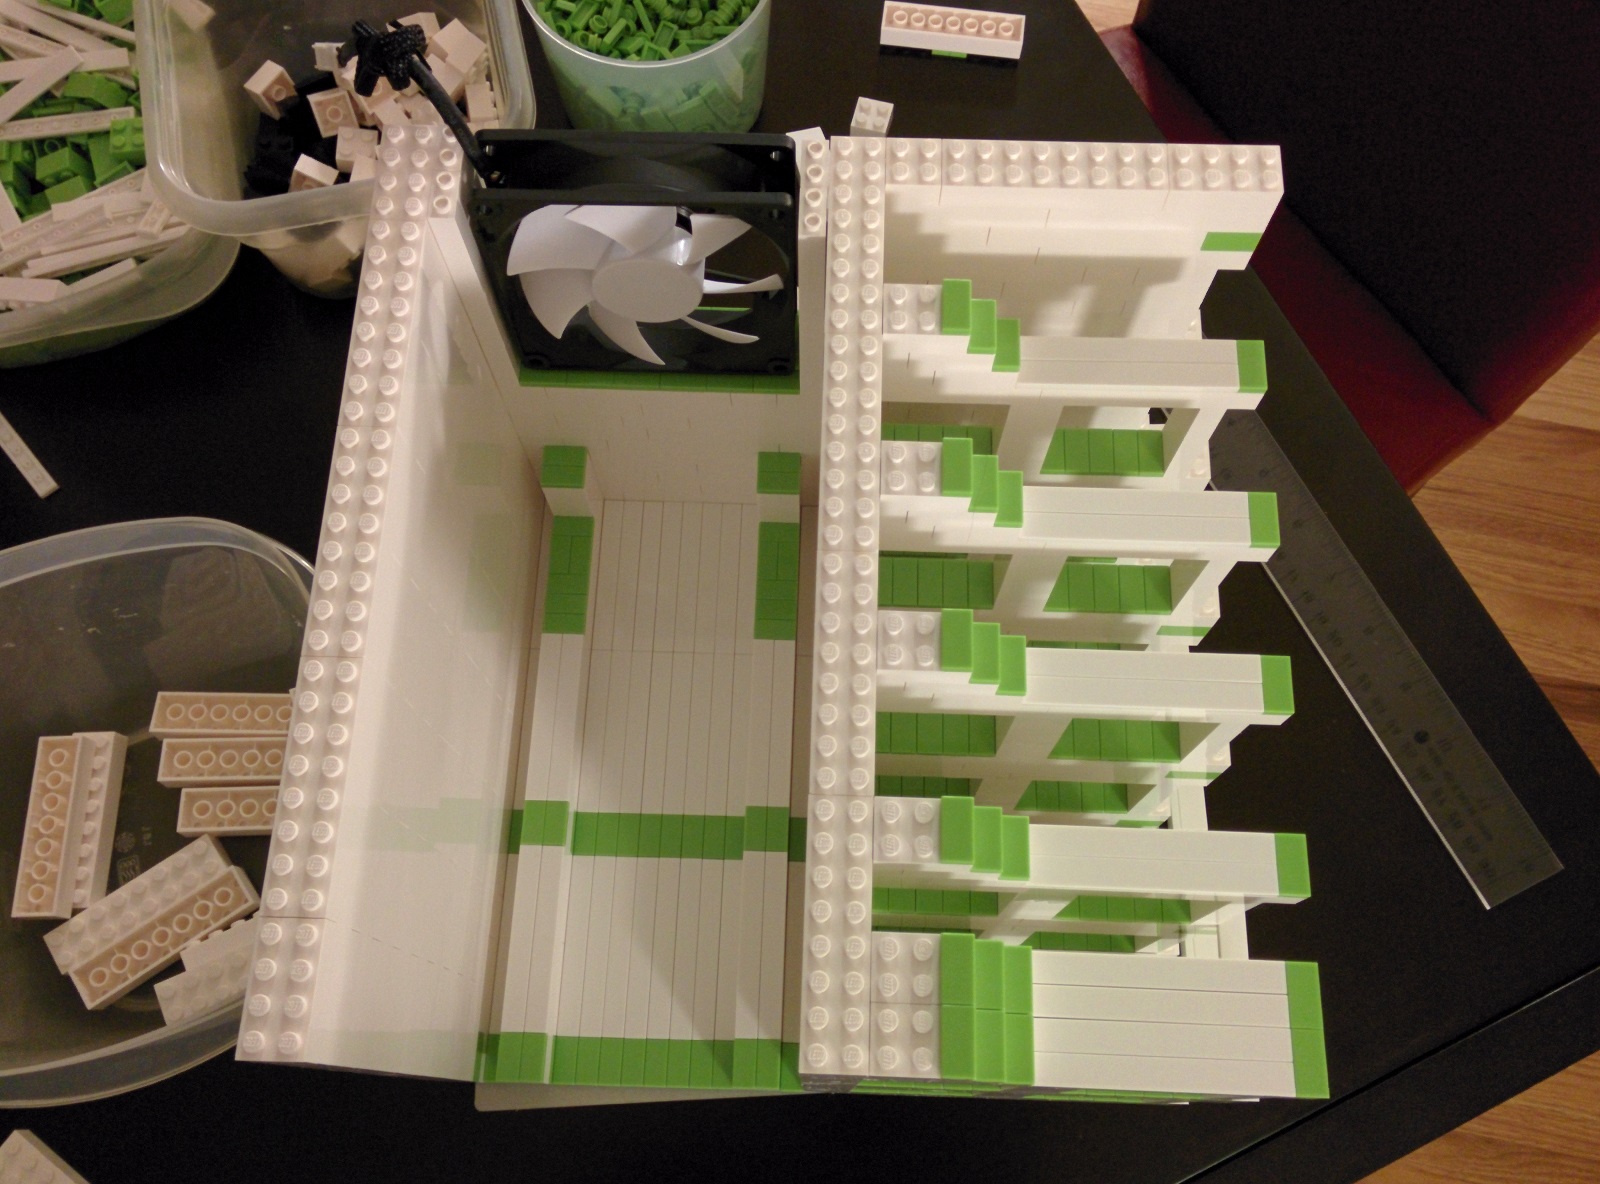
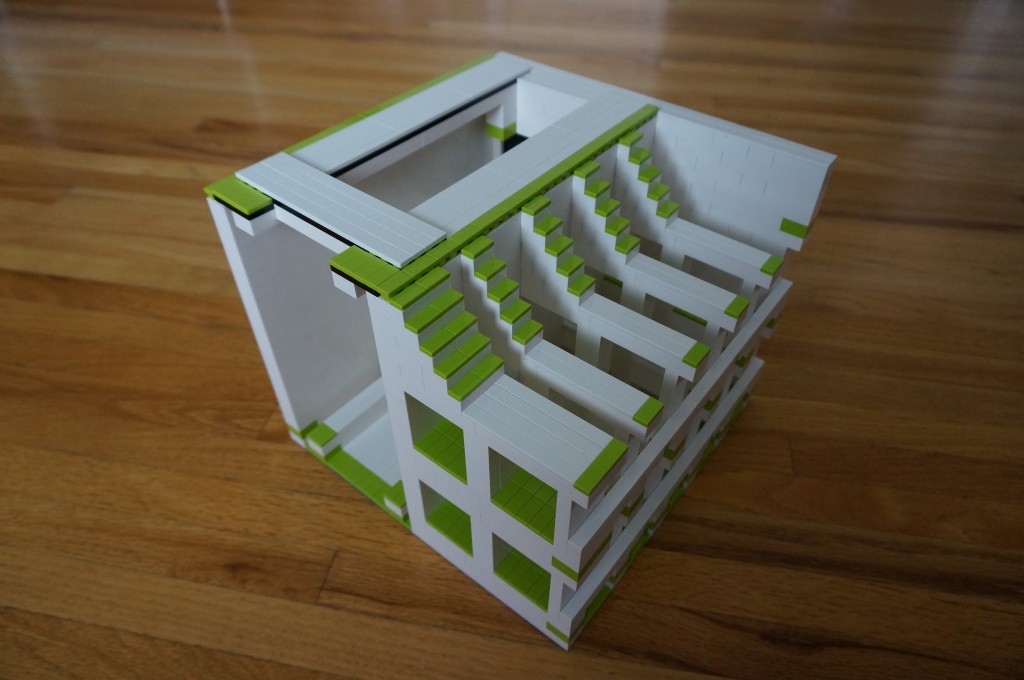
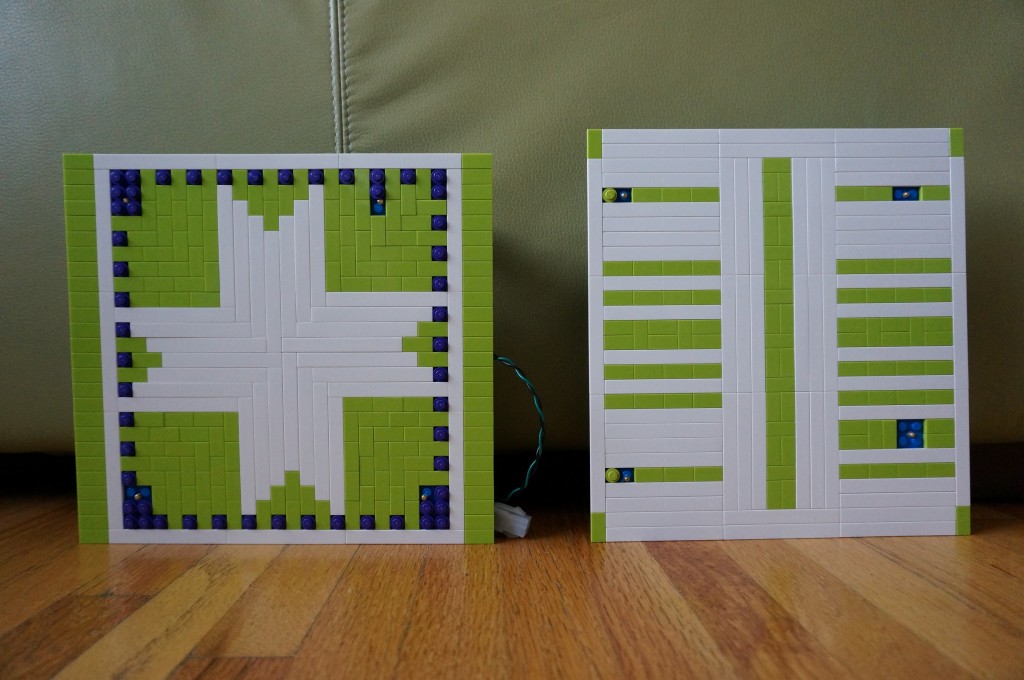
We needed to mount the motherboards to back-plates so that they could be mounted into the enclosure. As seen in the photo above, the mounted motherboards would slide into their respective grooves, and the space would be cooled by the fan mounted on the front. And as we had some spare LEGO, we dressed up the motherboard back-plates.

Server Build 2014 (60) Server Build 2014 (64) Server Build 2014 (71) Server Build 2014 (67)

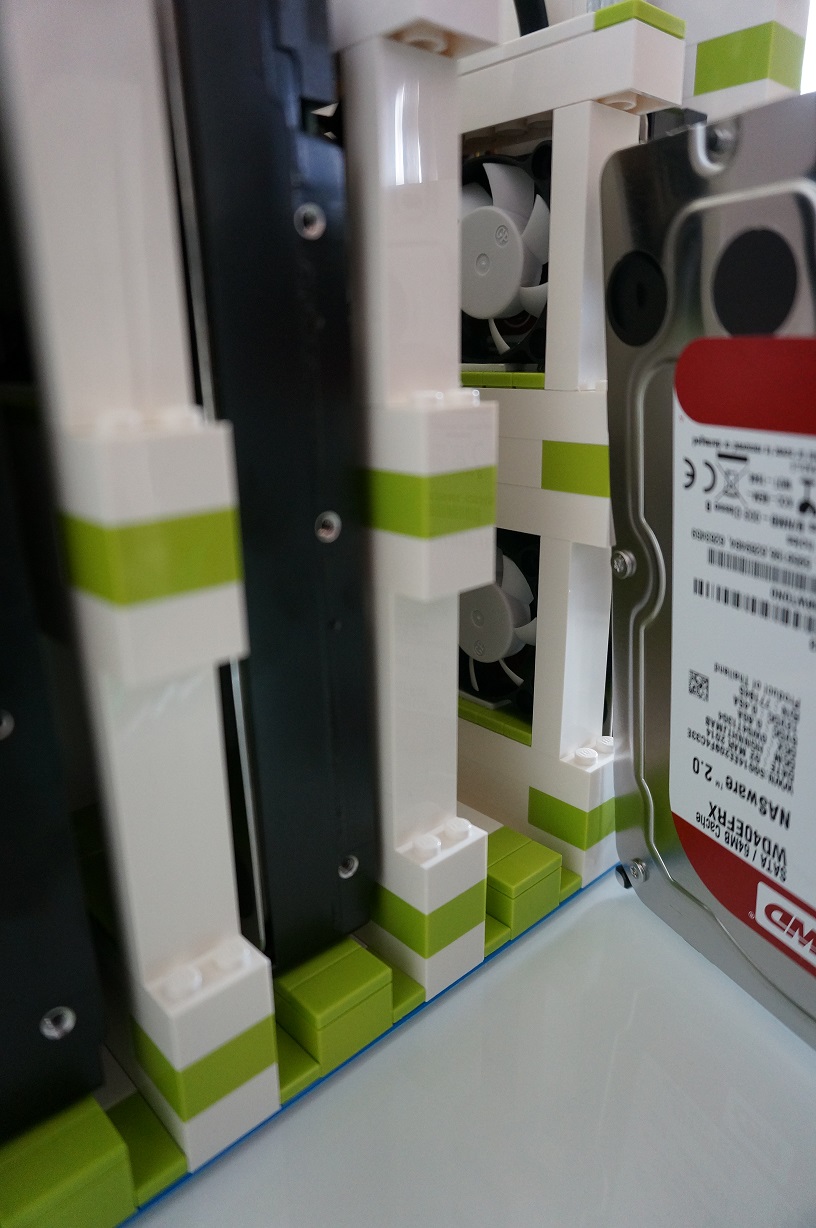
Next up was to mount the drives. Knowing that the HTPC’s SSD was smaller than the server’s HDD’s, we made its compartment smaller. It would be mounted in the first slot followed by the 4 HDD’s.

Server Build 2014 (77) Server Build 2014 (78) Server Build 2014 (82)


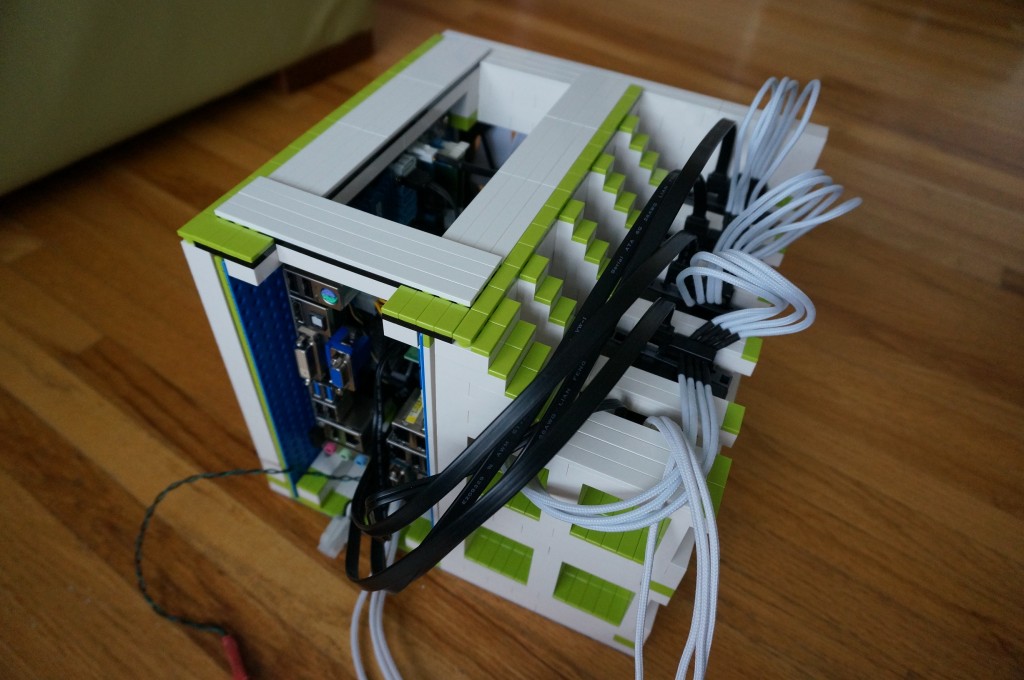
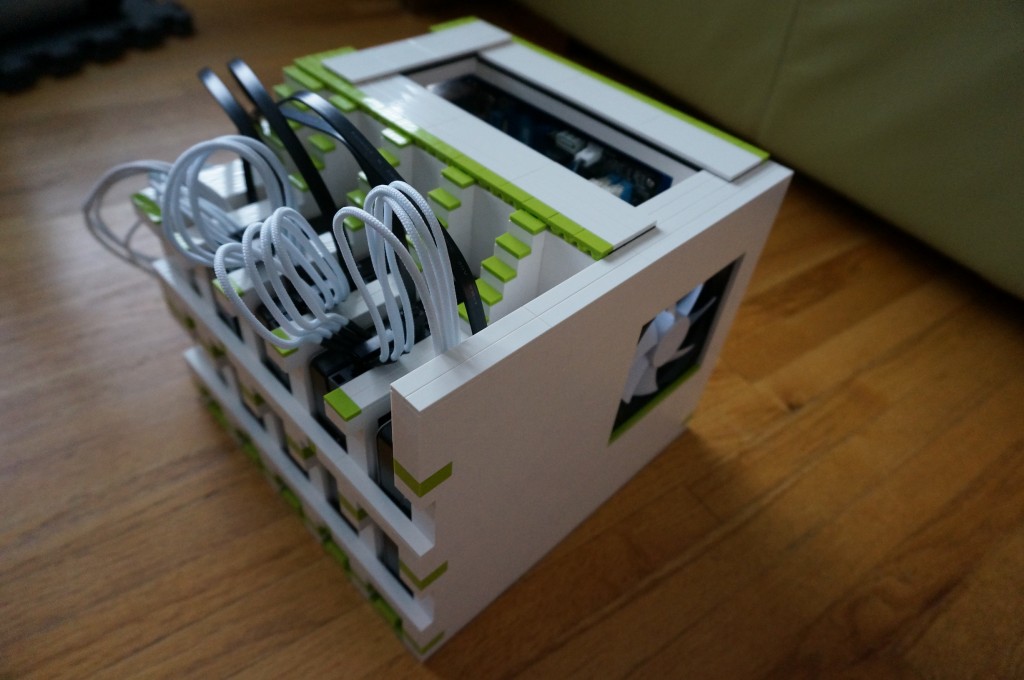
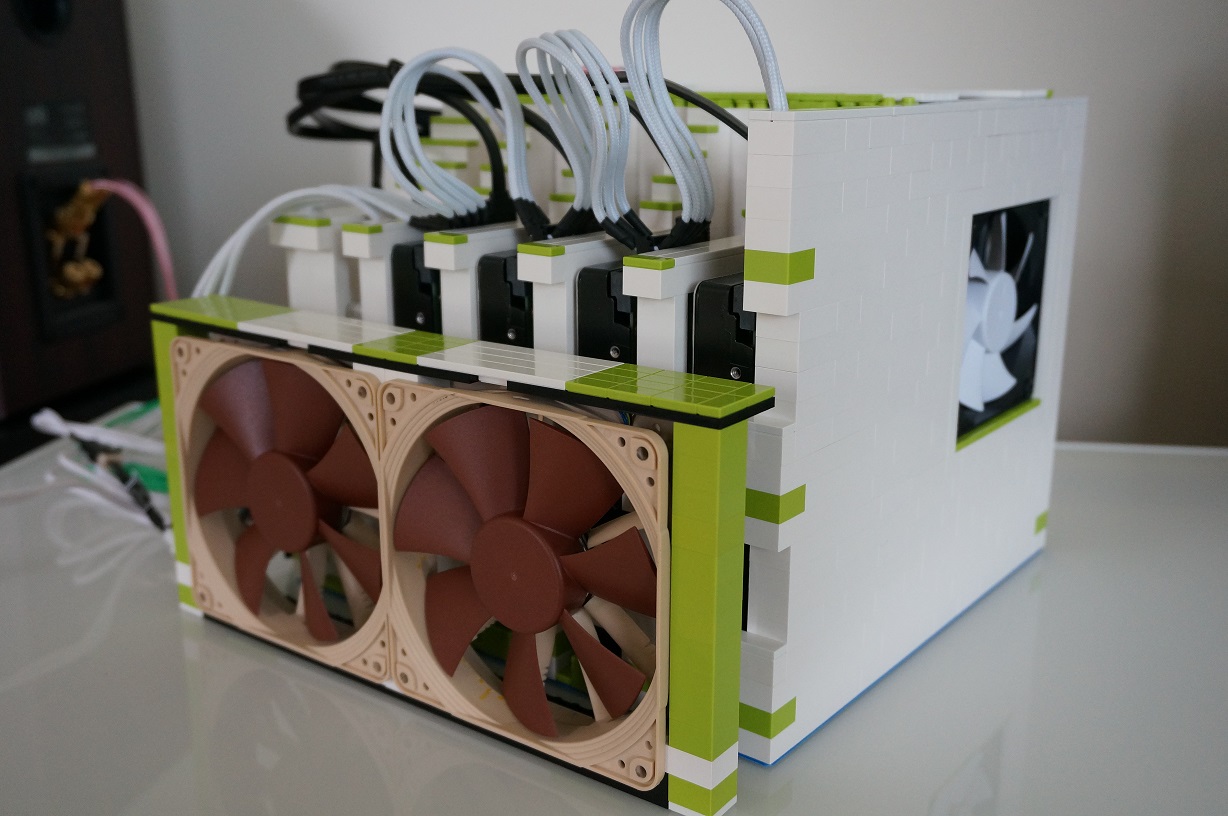
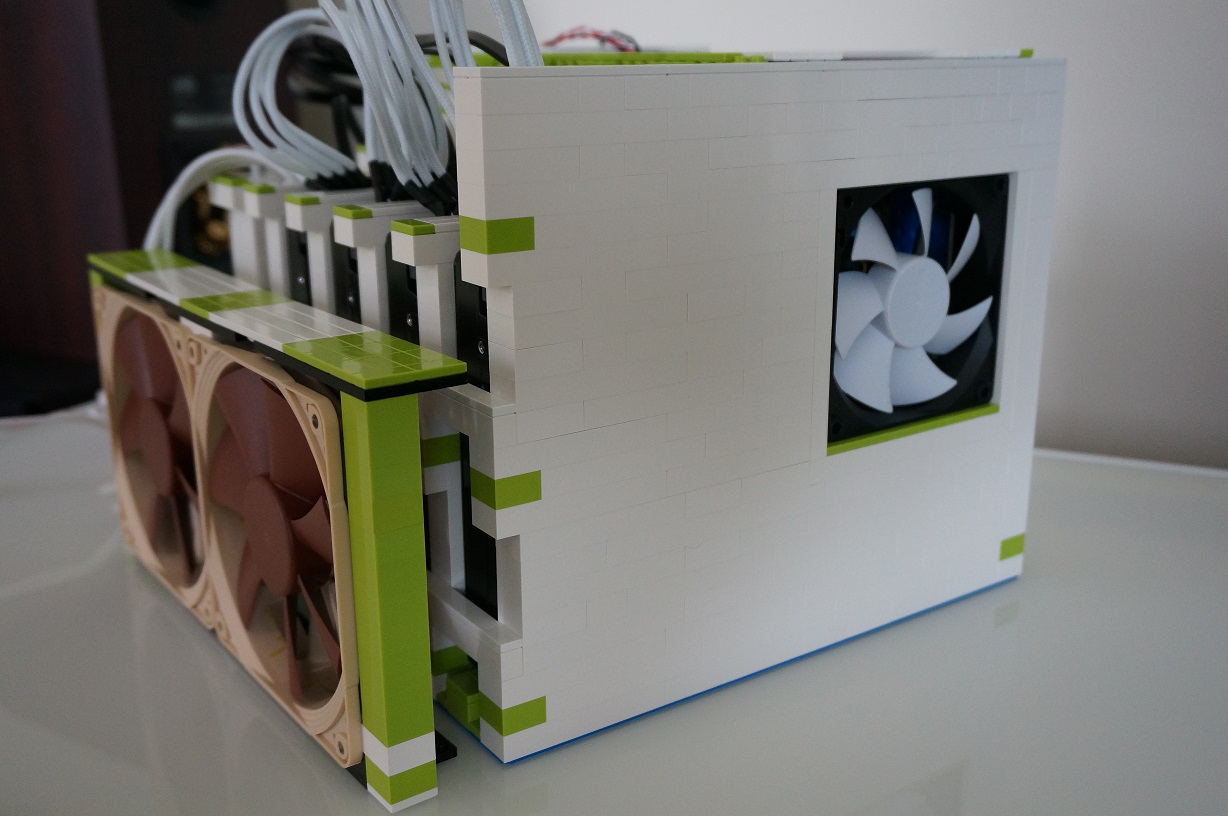
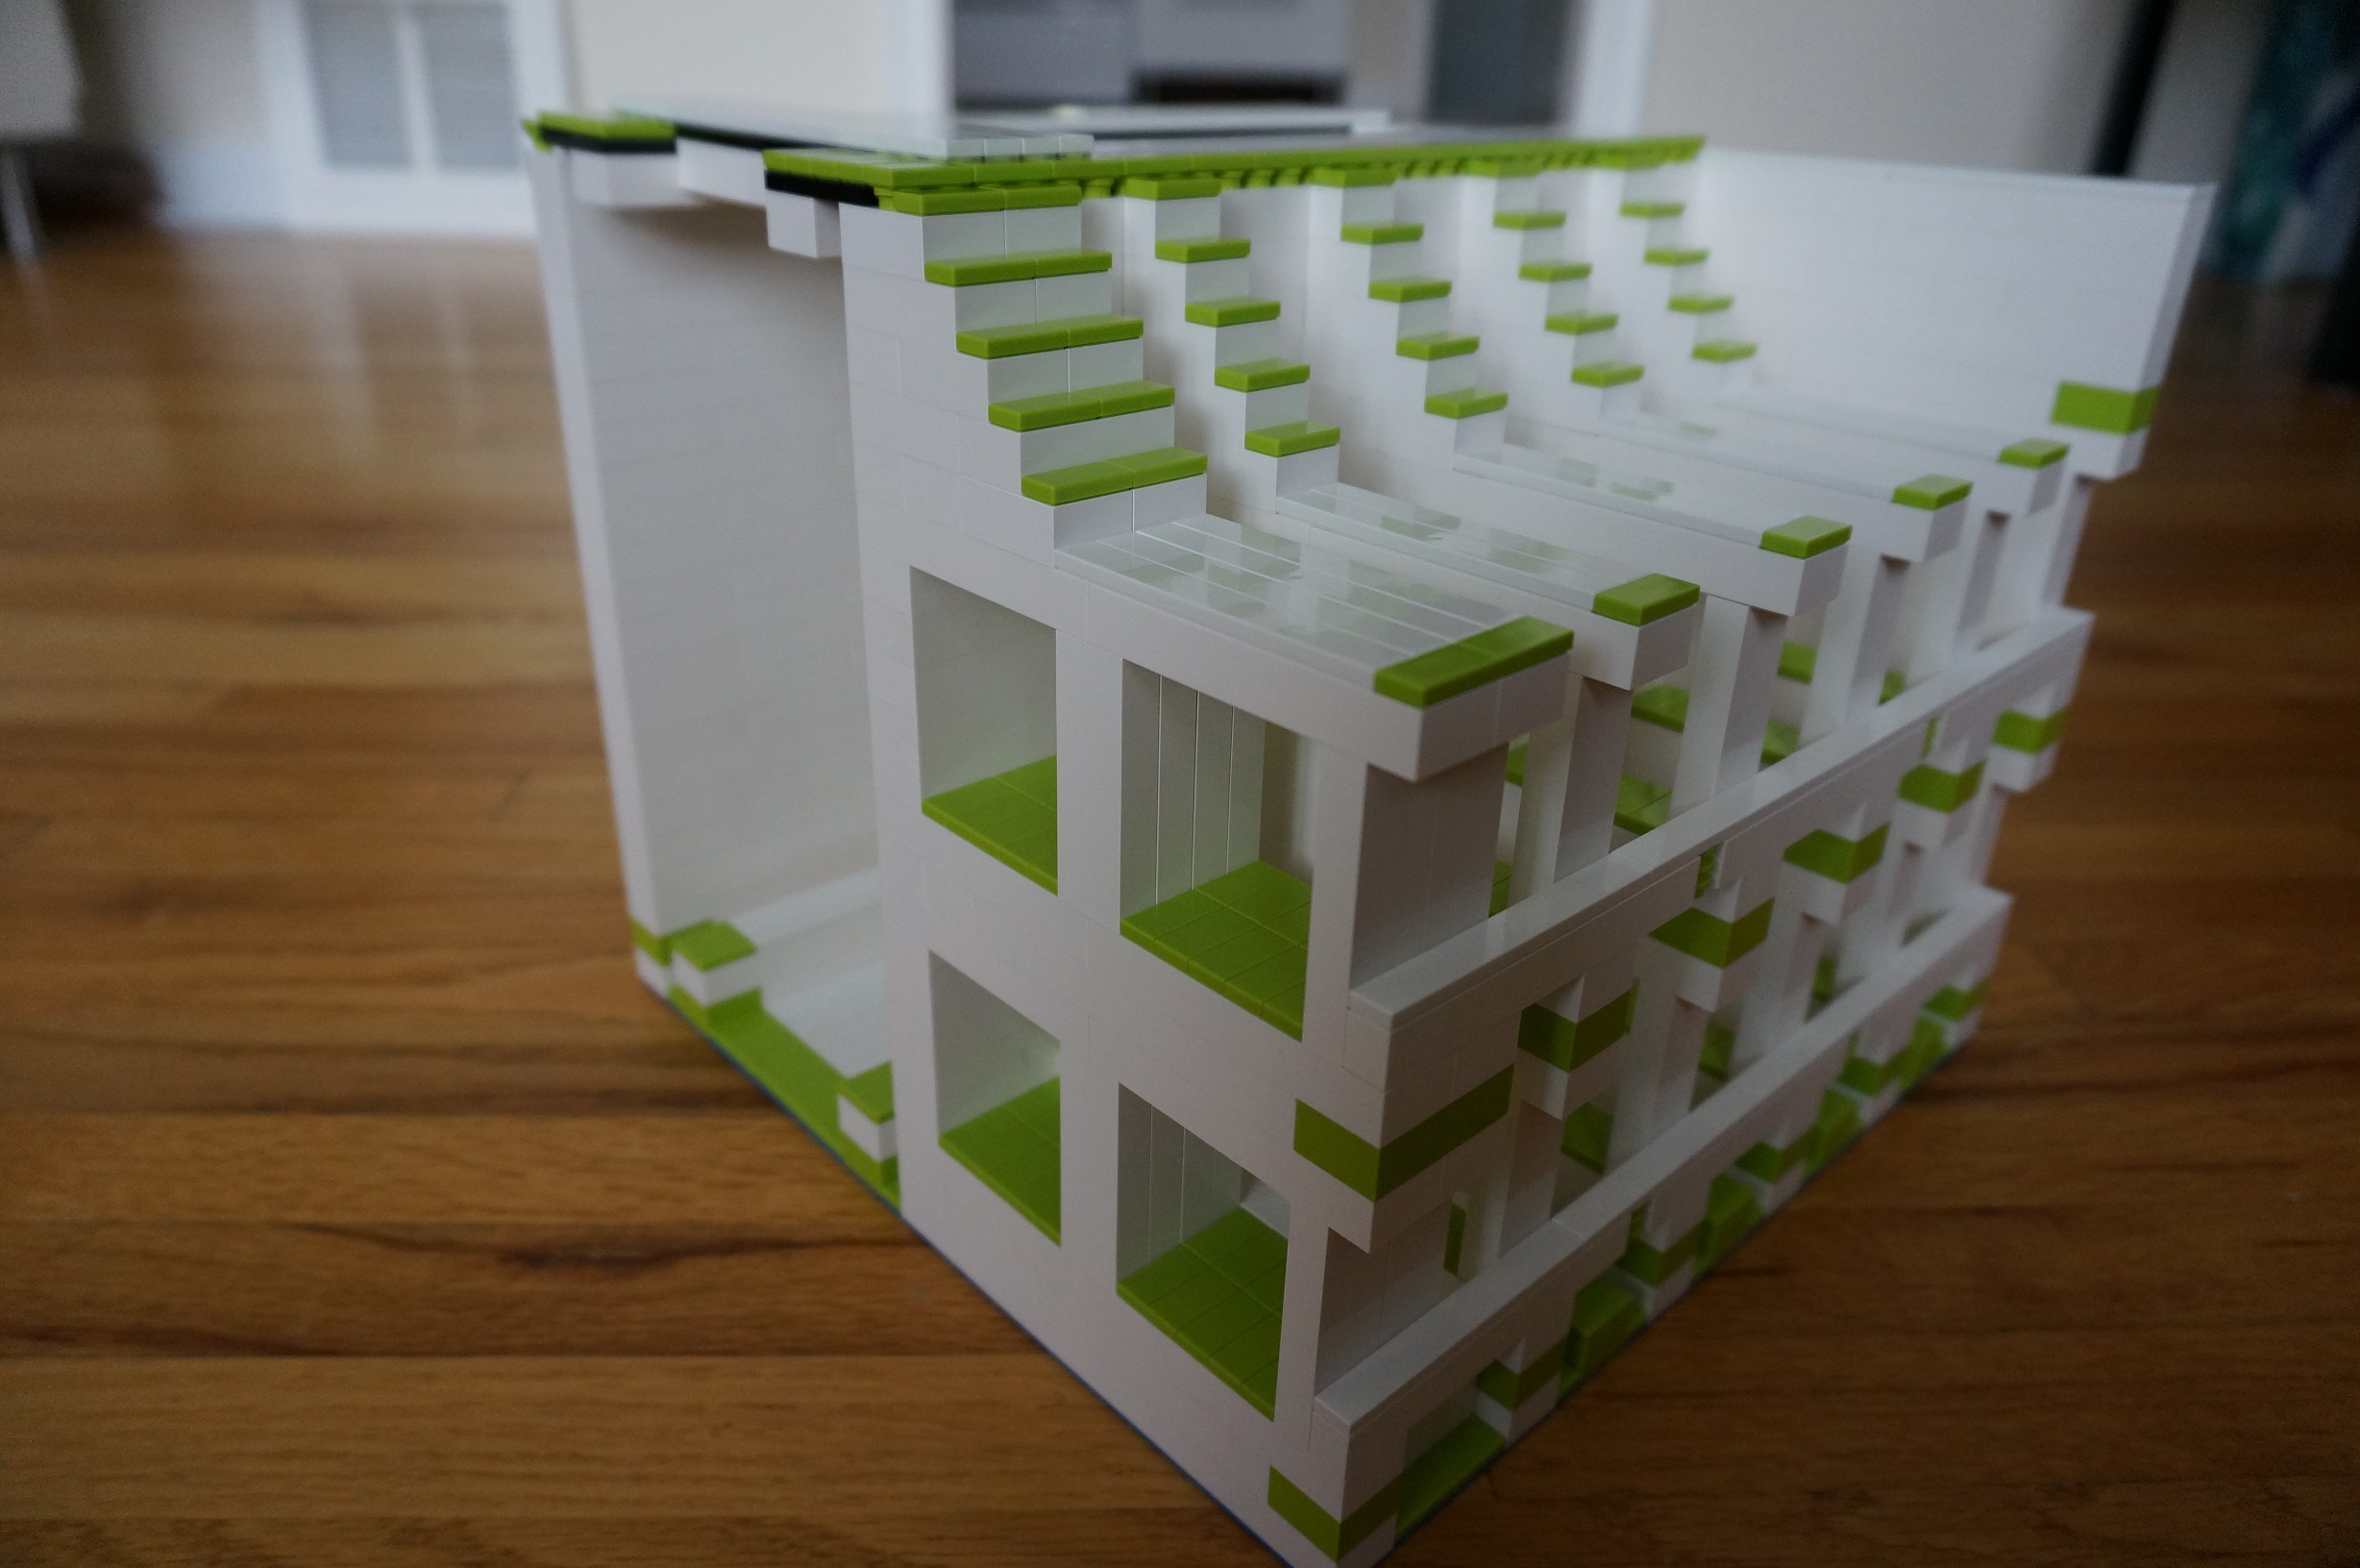
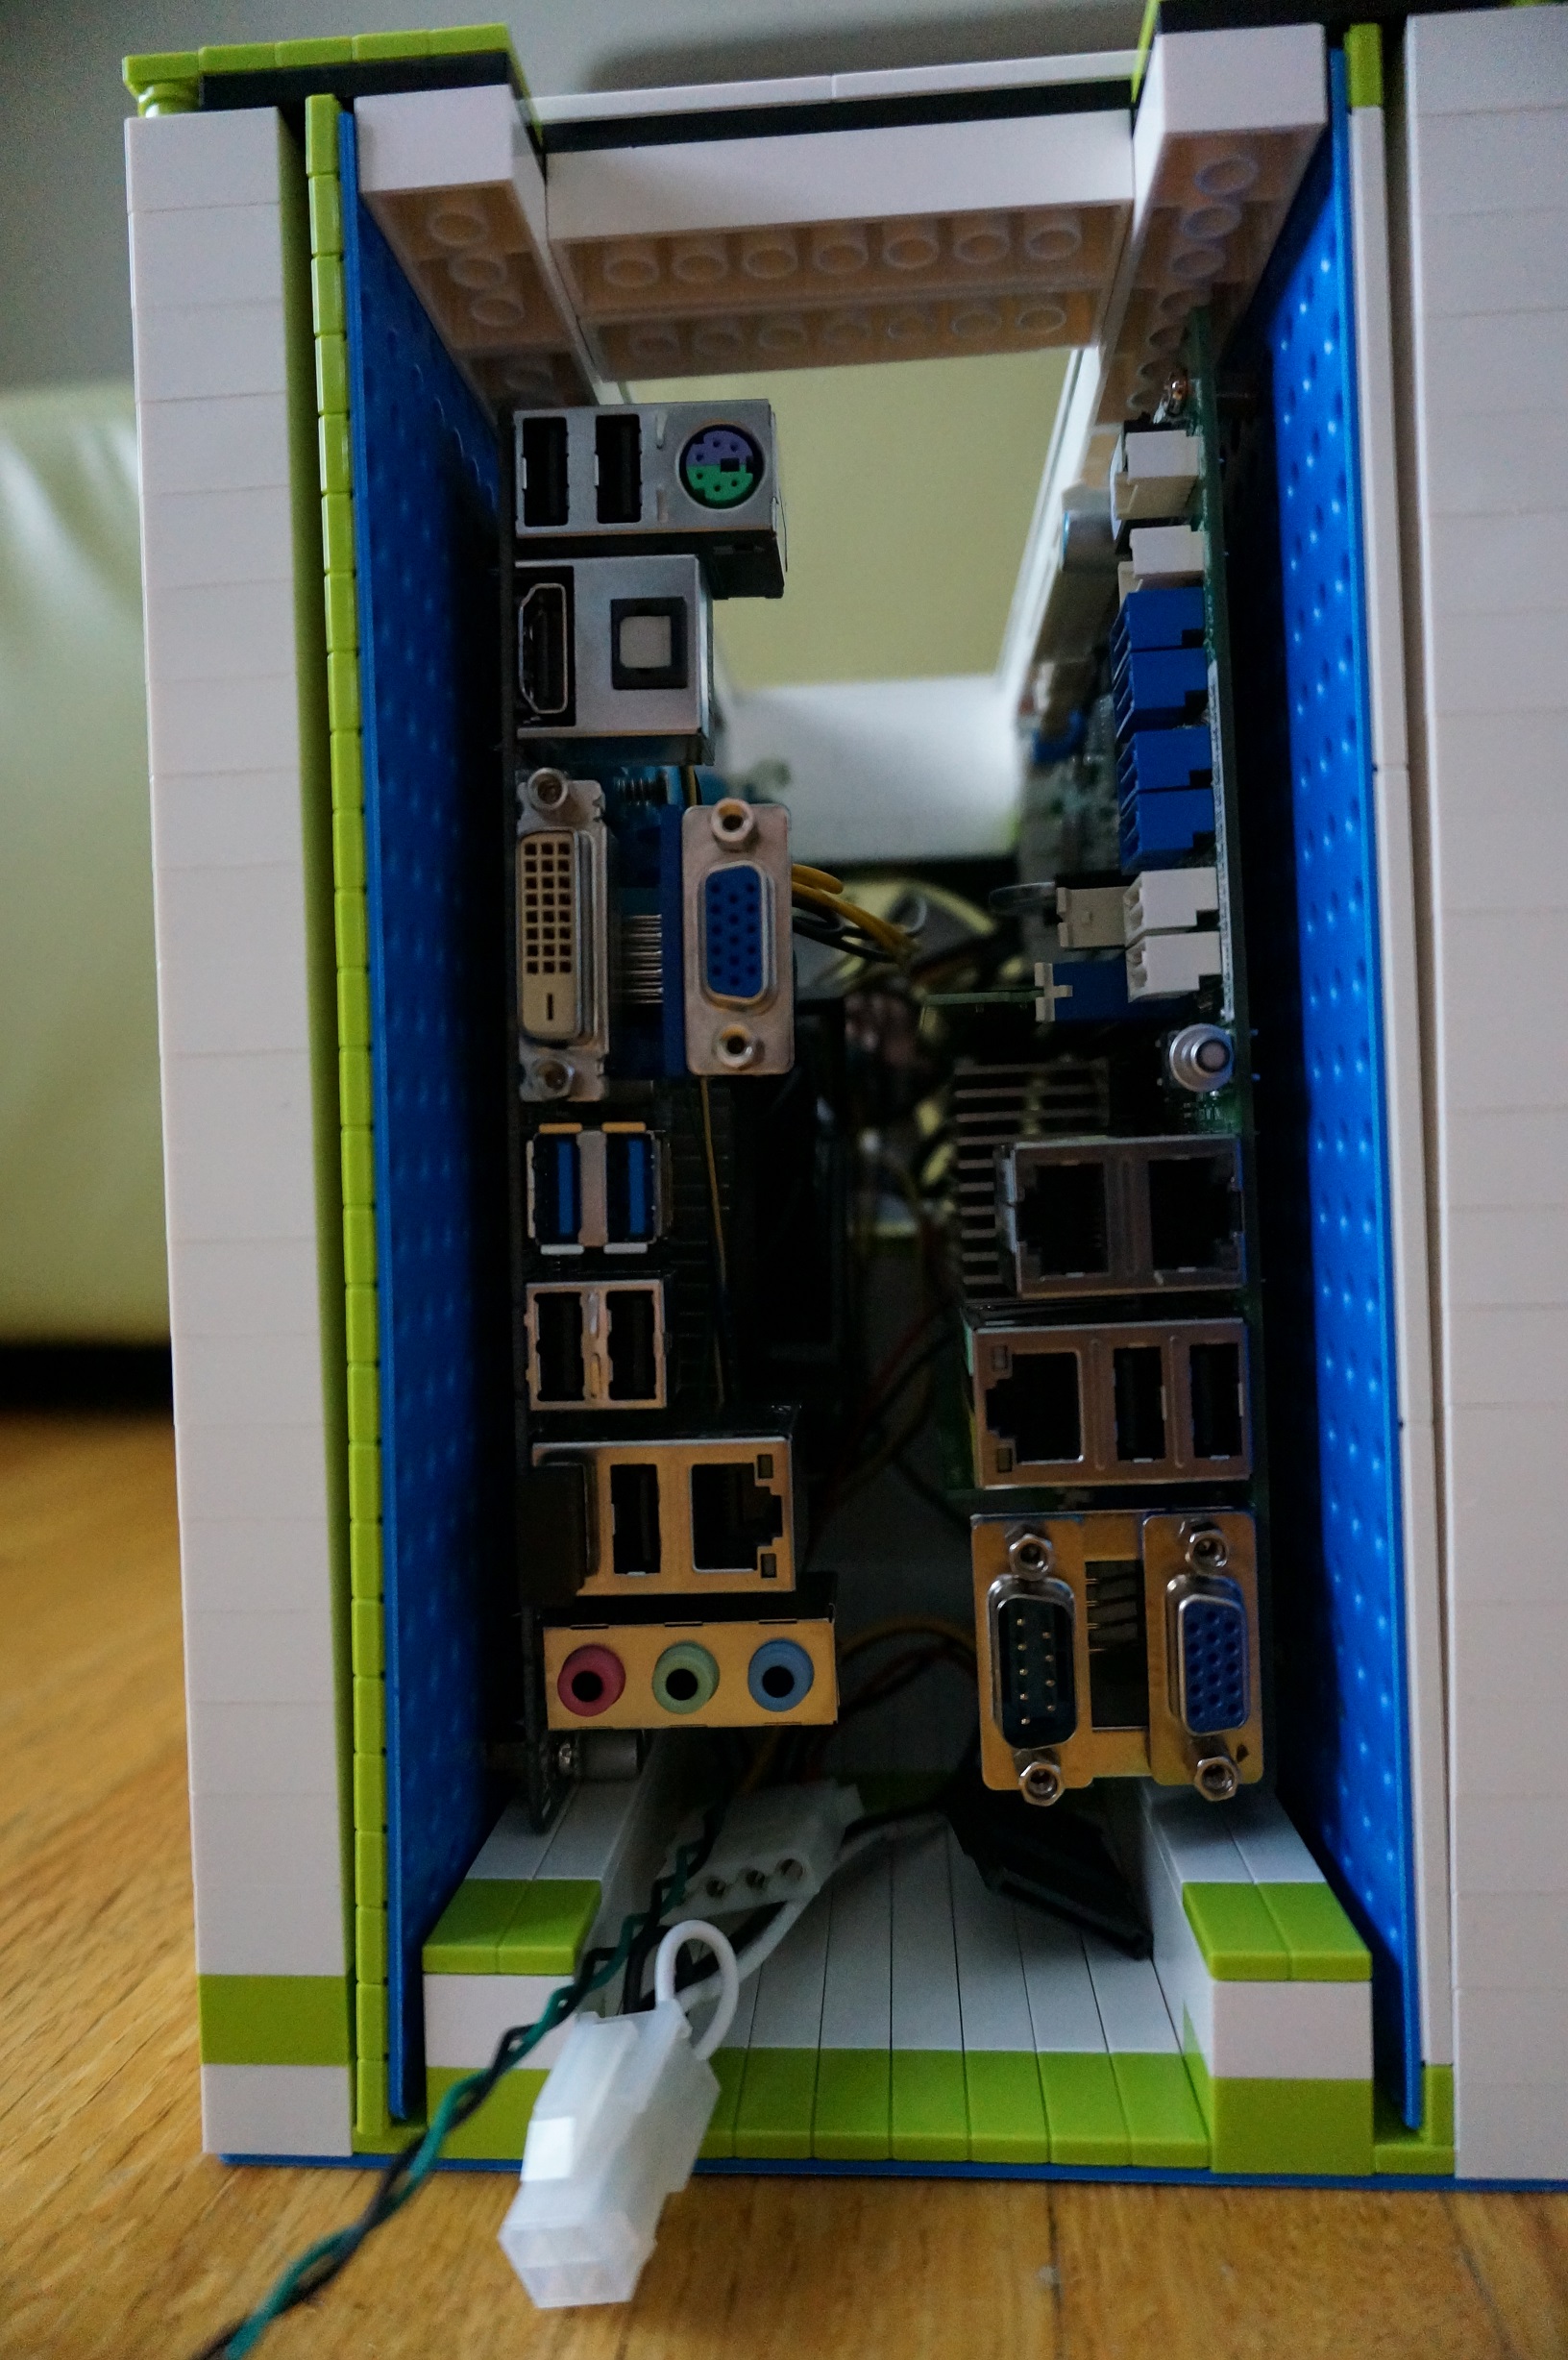
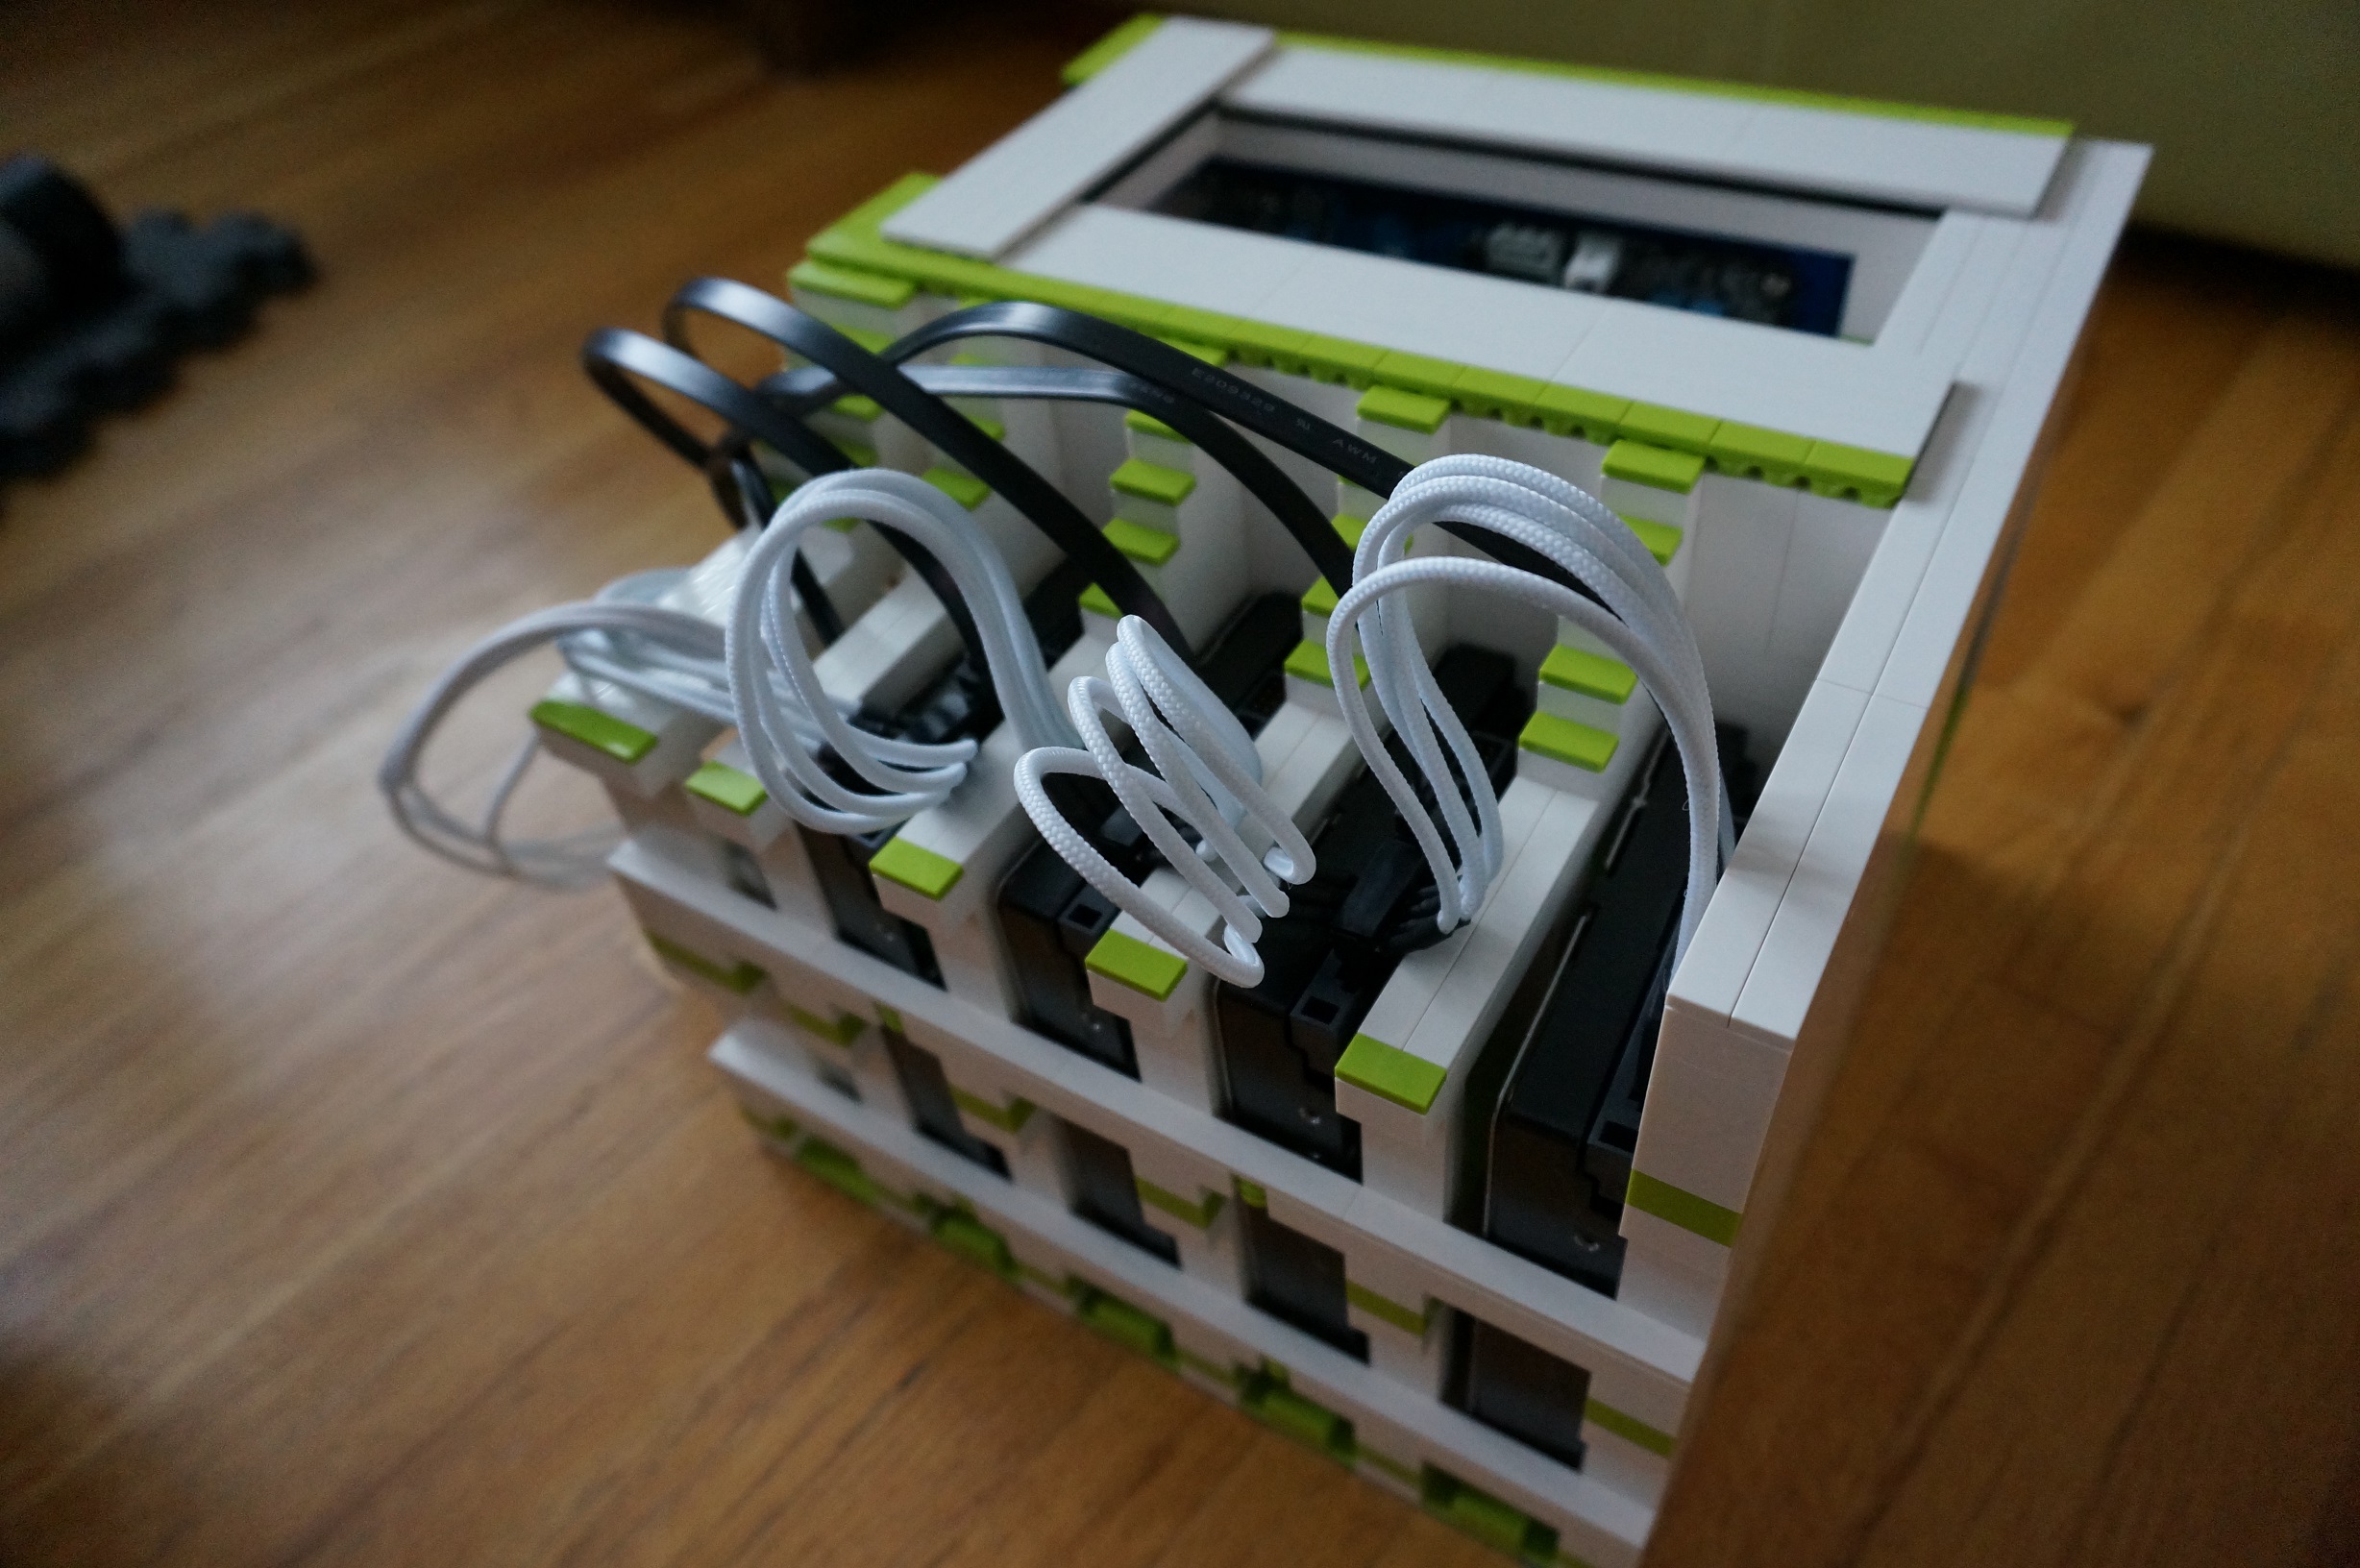
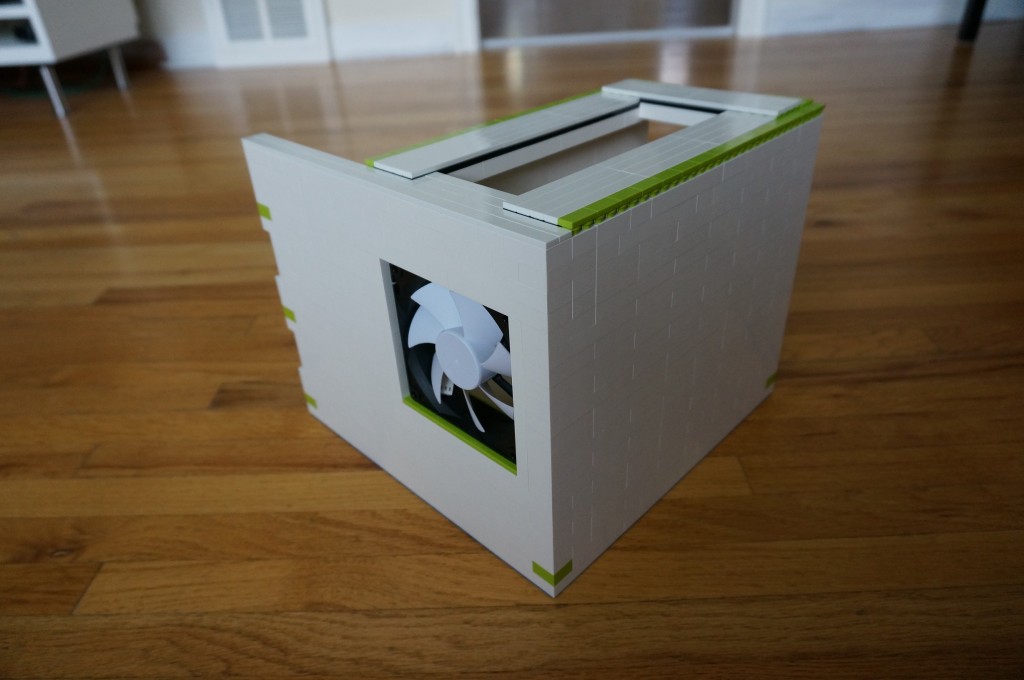
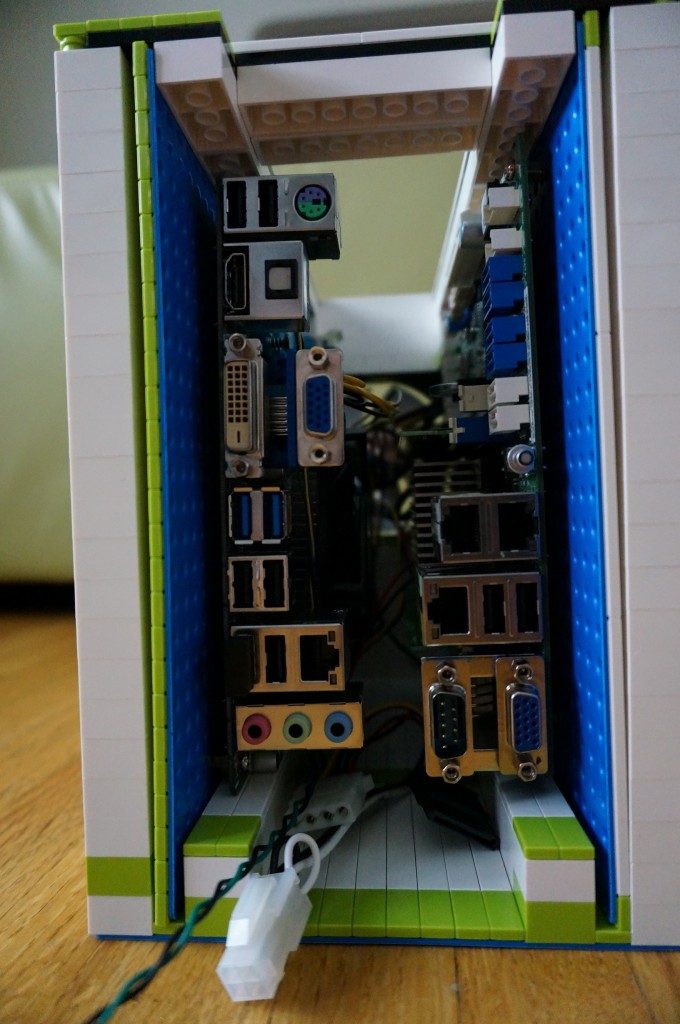
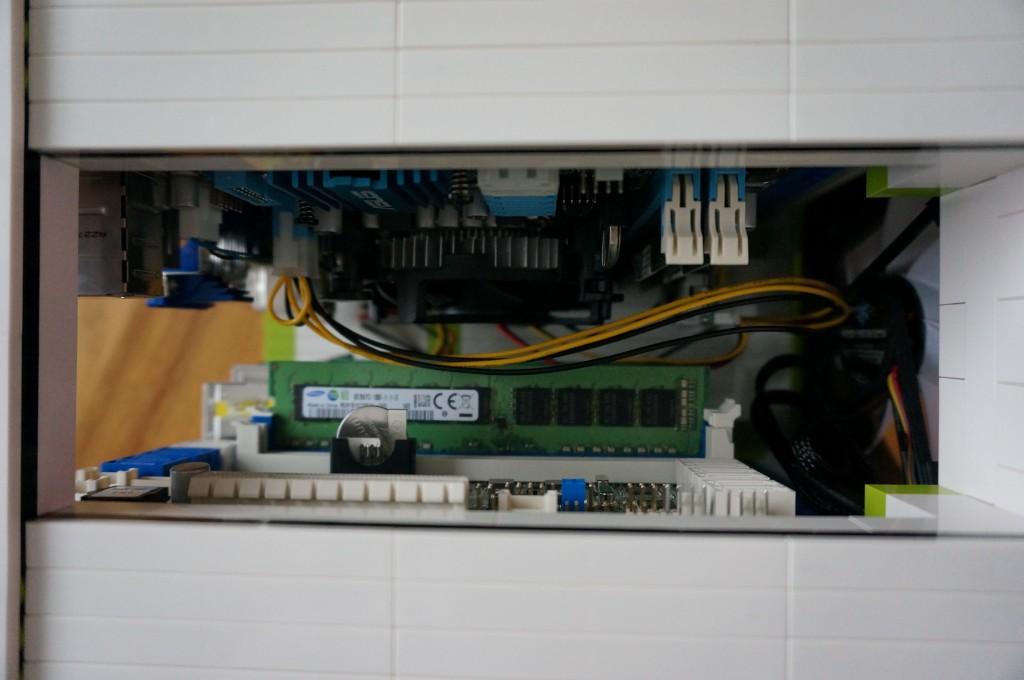
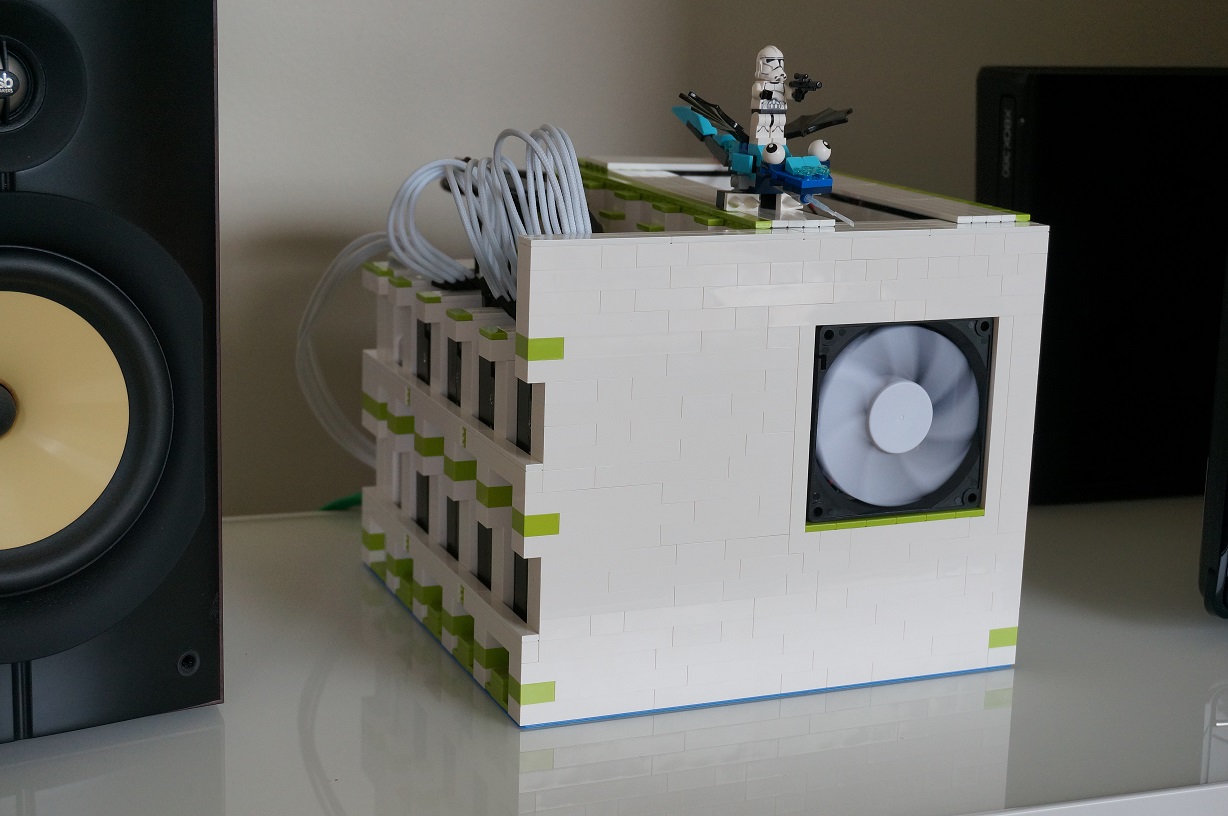
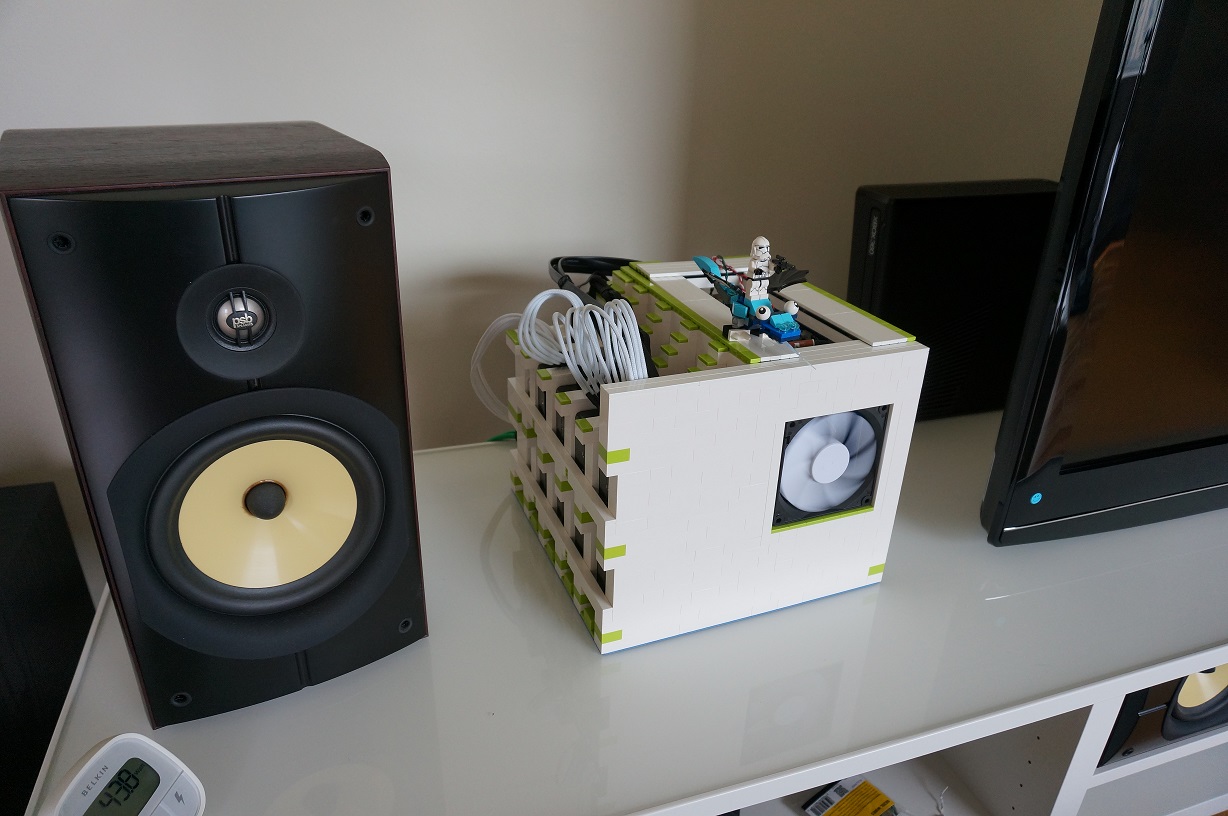
Here she is, all wired up and running:

DSC00262_1 DSC00258_1


—Part II: Configuring the Server (Coming Soon)—


New Keyboard and Mouse!

I picked up a new keyboard and mouse today to replace my aging, noisy, and rather small (for my hands) Razer units.

New: Func KN-460, Funch MS-3

Old: Razer Blackwidow, Razer Spectre

Lets start with the Func KB-460. Even though this board is about 2x the cost of the Razer, it feels like a luxury item. The board is coated in a soft touch rubber material, the keys sit atop a beautiful red underlay, and the red backlit keys really set it off. This board used Cherry MX Red mechanical keys, which mean very little noise, a moderate key weight, and a nice precision. The board is also a tad bigger than the Razer, which is nice. The Razer by contrast, used a cheap hard plastic material to cover the board, the keys were too small for me, there was no premium features like the red underlay or backlit keys, and it used the Cherry MX Blue keys which are loud, harder to press, and just too springy (if that’s a word) for my liking.

Here’s the Func with its Cherry MX Red Keys. You can even see the back-light LED above the key and can also make out the red underlay to the board:
Func (1)

Here’s the Razer with its Cherry MX Blue Keys:
Func (2)

Next, the Func MS-3 (again almost 2x the cost of the Razer Spectre) feels like a luxury item. The mouse is much bigger, making for a more comfortable and ergonomic feel. It also has 10 buttons placed around the mouse which can be programmed to do whatever you desire. The mouse also has back-light keys, which makes for an easy target if ever you forget where a specific button is.

Here’s a side-by-side of the Func (left) and Razer (right)
Func (5)

Overall, I would highly recommend both of these accessories!

Here’s a quick video showing the difference in sound between the two boards:

GeForce GTX 780 Upgrade

Last night I sold my GTX 770 and upgraded to the GTX 780. The recent price drops helped my decision. That and the performance gains, which can be summed up nicely by the GeForce Experience settings. The screen shot below shows the before (Current) and after (Optimized) setting. I should stay around 60 FPS in the below game (Battlefield 4), but I will gain back the anti-aliasing, some texture details, and some mesh detail that I had lost when making the jump from Battlefield 3 to 4 (Battlefield 4 being a much more graphically demanding game).

The 780 uses the same “Kepler” architecture as the 770, but basically doubles the die size to 7.1B transistors (vs. 3.5B on the 770). The 780 also adds 1GB of VRAM bringing the total to 3GB. The extra kick of VRAM is likely where the anti-aliasing performance comes from. And the doubling of die size is what’s giving us the raw horse power to gain back the texture/mesh details.

History Lesson -> About 2 years ago now Nvidia released the GTX 680. This was the first card built on the Kepler architecture and, like the 770, had a die size of 3.5B transistors. The 680 was rated with a 195W TDP and preformed great at the time. Fast forward 1 year to the summer of 2013, and it was time for Nvidia’s yearly product refresh. With no new architecture until 2014, the solution was to put the 680 on steroids. Same die size, faster clocks – hence the 770’s new TDP of 230W. This move however, would not be enough to stave off the competition, and more importantly would allow that competition to overtake Nvidia’s “fastest GPU” crown. So with the 770 now slotting into Nvidia’s #2 position, the new #1 would need to gain performance. To do this Nvidia doubled the 770’s die size, gaining performance in numbers. Interestingly enough, despite the 780’s larger foot print, both the 770 and 780 consumer roughly the same amount of power (~250W). Gaining performance in numbers rather than by clock speed increases proves to be more efficient.


FPS4

Nvidia Geforce Experience Impressions

I was playing around with this software this morning and decided to capture the FPS from a game of BF3 TDM. Using the FRAPS tool, I logged the FPS to an excel file and graphed the findings. The optimized settings look to be doing their thing as the FPS never really drop below the magical 60 mark. I think the FPS I get is not what’s important here, it’s how the optimized settings come together to keep my game above 60 FPS. It’s also interesting how much the FPS jumps around. I was expecting more or less a straight line. I’m guessing the graphical loads in a game of TDM change based on the action.

Any who, here’s the graph:
X-axis – FPS
Y-axis – Time in sec

FPS1


UPDATE:

Tonight, I did a couple tests with battlefield 4.
About half way though this capture I switched from the optimized setting to an Ultra setting.
I lost about 20FPS right away, and the game felt that much worse – choppy and such. Nice to see that it’s doing its thing.
With the optimized settings, I pretty much say goodbye to anti-aliasing, and make the switch from ultra-to-low on some of the other settings.
And there is no headroom for scaling. This game is really demanding relative to battlefield 3!

FPS2


FPS3